
Landing page A/B testing, also called split testing, means showing two or more versions of the same page to different visitors at the same time and measuring which one delivers more of a commercial outcome you defined in advance. Nielsen Norman Group describes it as a quantitative method that compares live design variations against predetermined business-success metrics, with traffic divided so that each visitor sees only one variation. Done properly, it replaces opinion with evidence. Done carelessly, it produces confident answers to questions the data never actually settled.
This guide sets out how we approach it: designing the test, sizing it honestly, choosing between A/B and multivariate methods, prioritising a roadmap and reading the result.
A landing page has one job: to move a visitor towards a single action, whether a demo request, a purchase or a donation. A split test isolates one change to that page, sends a share of traffic to each version and compares the outcome. Because both versions run concurrently, seasonality, campaign changes and news cycles affect each version equally, which is the structural advantage over comparing this month with last month.
In practice, platforms such as HubSpot’s page testing serve both variants from the same live URL and keep a visitor on a consistent version within a session, so the experience stays coherent. Most tools default to an even split, though uneven splits are possible when a team wants to limit exposure to a risky variant.
The method answers “which version performed better”. It does not tell you why, which is why the quality of your hypothesis matters more than the choice of software.
Every test we run begins with a written hypothesis that links evidence to a change and a measurable consequence. A workable structure is:
A vague hypothesis such as “a cleaner design will convert better” cannot lose, so it cannot teach you anything. A precise one can.
Choose one primary metric, as close to revenue as your volume allows. For a B2B lead generation page, qualified leads are a better measure than raw form submissions, because a shorter form can lift submissions while lowering lead quality. For an e-commerce page, revenue per visitor usually tells you more than click-through. For a charity, completed donations and average gift matter more than button clicks. Add two or three guardrail metrics, such as bounce rate or refund rate, that must not deteriorate while the primary metric improves.
Start where the potential effect is largest, which is almost always the message before the layout.
HubSpot’s documentation lists calls to action, copy, media and form length as practical variables, which matches what we see across B2B and e-commerce accounts. If your messaging itself is unclear, fix that first: our piece on B2B website messaging built on buyer phrases shows how to find the language worth testing.
This is where most landing page programmes fail quietly. A test needs enough visitors in each variant to detect the size of effect you care about, and small effects need far more traffic than large ones. Practitioners commonly plan for 95% confidence and 80% power, estimate the sample size before launch, and run for at least one full business cycle so that weekday and weekend behaviour are both represented.
The practical consequences are these:
We would rather run one properly powered test than four underpowered ones. An inconclusive result you trust is more useful than a win you cannot reproduce.
An A/B test compares whole versions, which can differ in many ways. A multivariate test changes several elements at once in a structured set of combinations, so it can attribute effect to individual elements and their interactions.
The trade-off is traffic. Nielsen Norman Group explains that multivariate testing needs much more traffic and suits incremental refinement, whereas A/B testing suits dramatic redesigns. Its recommended sequence for major changes is to A/B test the original against the new design, then refine the winner with multivariate tests.
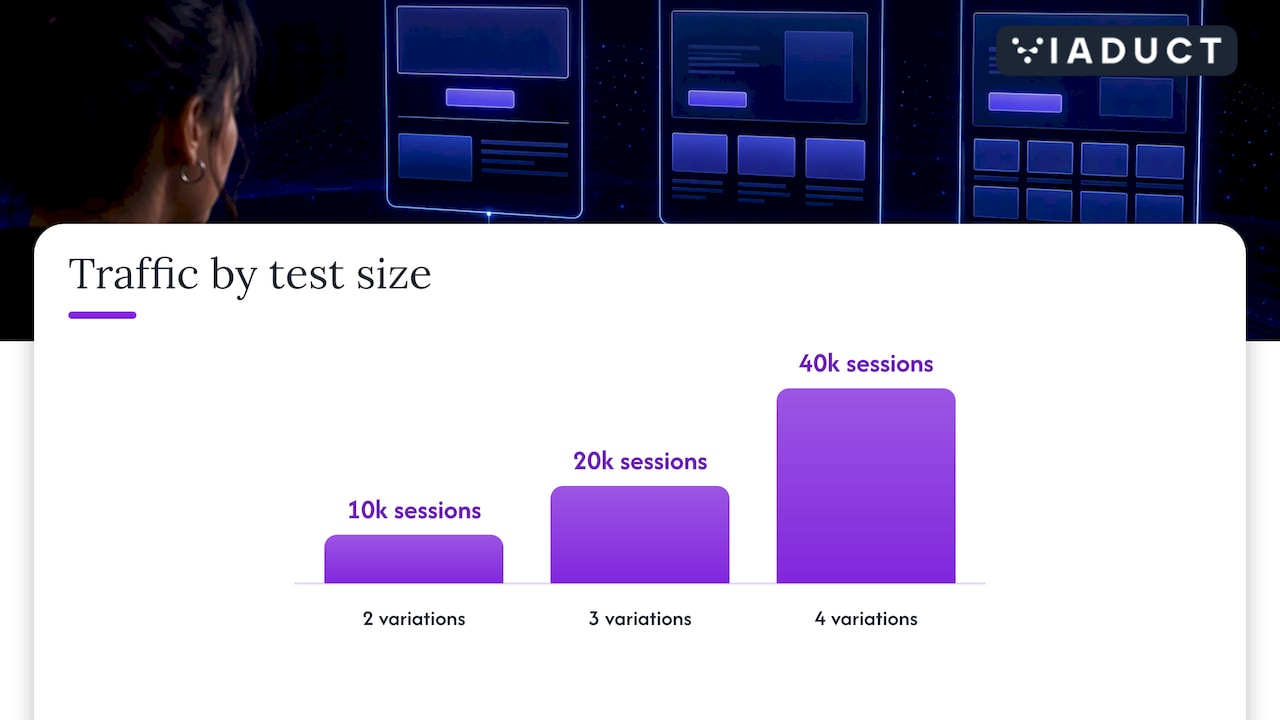
The arithmetic is unforgiving. Two headlines, two images and two calls to action produce eight combinations, each sharing the same traffic. Shopify UK suggests that A/B tests usually return reliable results in one to two weeks, and offers a rule of thumb that traffic doubles with each variant added: 10,000 sessions for two variations, 20,000 for three and 40,000 for four. Matomo recommends aiming for 10,000 or more visitors a month before considering multivariate.
| Situation | Better method |
|---|---|
| Under about 10,000 monthly visitors to the page | Sequential A/B tests |
| Testing a new layout or a different offer | A/B test |
| Refining several elements on a proven page | Multivariate, with ample traffic |
| Unsure which element drives performance | A/B test one element at a time, in priority order |
For most mid-market landing pages, a disciplined sequence of A/B tests is the more reliable route.
A backlog of ideas becomes a strategy once each item is scored, scheduled and documented. Two scoring models are widely used: ICE (impact, confidence and ease) and PIE (potential, importance and ease), each element scored from 1 to 10 and combined into a ranking. The model matters less than applying it consistently and tying confidence to evidence rather than enthusiasm.
A roadmap should go beyond ranking. Optimizely’s guidance on experimentation roadmaps recommends tracking the experiments in priority order, a balanced schedule, timelines, potential interference with other campaigns, who is involved, available resources and alignment with company objectives. That last point is often missed: a test that wins on conversion but conflicts with a brand repositioning is not a win.
In practice, we recommend:
We have set out how to link the calendar to commercial outcomes in building a CRO testing calendar that lifts revenue. If your tests depend on advertising creative, the 90-day creative testing framework shows how page and ad tests can reinforce each other. For teams wondering where machine learning fits, see our view on AI-driven A/B testing.
If you are still at the stage of setting up the page itself, a guide to building a landing page with the right tracking and forms in place makes later experiments far easier to measure.
A statistically significant result is not automatically a commercially useful one. Before launch, set the smallest improvement that would justify the cost and risk of rolling out the change, and judge the result against that threshold and your guardrail metrics, not against significance alone. Changing the metric, the conversion window or the stopping rule after seeing the data invalidates the test.
When a test finishes, record four things: the hypothesis, the result with its uncertainty, the decision taken and what the result suggests for the next test. A win on a headline might point towards testing the same message in your adverts. A loss on a shorter form might show that your audience values the reassurance of a fuller qualification step. The compounding value of testing lies in this record, not in any single uplift.
Our conversion rate optimisation service covers funnel mapping, A/B and multivariate testing and the analysis that connects page changes to revenue. It runs inside our 90-day growth sprint, so testing is planned alongside search, paid media and email rather than treated as a separate exercise. We work with B2B businesses, e-commerce companies and charities that want a structured programme with defined deliverables and commercial targets.
Long enough to reach the sample size you calculated before launch, and for at least one full business cycle, which is often a minimum of two weeks. Stopping early because one version looks ahead raises the risk of a false winner. If the required duration is unrealistic, test a bolder change instead.
In most marketing contexts the terms mean the same thing: comparing versions of a page by splitting traffic between them. Some teams use “split test” for tests that send traffic to entirely separate URLs, but the method and the statistics are the same.
Yes, but adjust the approach. Test large changes such as a different offer, use a metric higher up the funnel, and run one documented test at a time. Where the traffic still cannot support a result, qualitative evidence from user interviews and sales calls is more reliable than an underpowered test.
Test one change at a time unless you have the traffic for multivariate testing. A single-variable test tells you which change caused the effect, and it reaches a conclusion faster on typical landing page volumes.

