
Conversion rate is a seductive metric. It is easy to measure, easy to report, and easy to improve in ways that do not actually benefit the business. You can lift conversion rate by removing premium products from your catalogue, by offering aggressive discounts, or by targeting only your most purchase-ready audiences. None of those moves improve the health of the business.
The more useful frame for a CRO programme is revenue per visitor. This metric captures the interaction between conversion rate, average order value, and product mix. A test that lifts conversion rate by 10% while reducing average order value by 15% is a net loss, but a conversion rate dashboard will not tell you that.
Consider a checkout test that simplifies the form sequence. It reduces friction and lifts conversion rate. But if the simplified flow removes cross-sell prompts that were contributing to average order value, the net revenue impact is negative.
Or consider a product page layout test. The new layout increases add-to-cart rate. But if the old layout prompted more customers to read full product specifications, reducing returns and improving satisfaction, the downstream impact is worse than the headline metric suggests.
Every test in your calendar should define its success metric before launch. Conversion rate is often the right primary metric for a specific test, but revenue per visitor should always be the lens through which you evaluate overall programme performance.
With limited testing capacity, the sequencing of tests matters as much as the quality of individual experiments.
ICE scoring evaluates each test on Impact (how much could this move the needle), Confidence (how strong is the evidence), and Ease (how quickly and cheaply can this be implemented). Each dimension is scored on a 1-10 scale and averaged. Tests with high ICE scores run first.
PIE scoring uses Potential (headroom for improvement), Importance (traffic or revenue flowing through this element), and Ease. It is particularly useful for teams prioritising across a large site, where some pages simply matter more than others.
Neither framework is perfect. Both rely on subjective scoring. Their value is in forcing explicit prioritisation discussions rather than defaulting to whoever has the strongest opinion in the room. Tools like Optimizely and VWO both include backlog management features that support structured prioritisation within the platform.
Timing a test incorrectly can invalidate its results entirely. A test running across Black Friday and Cyber Monday will capture visitor behaviour that is fundamentally different from the rest of the year: different intent, different price sensitivity, different device mix. Results from that window are not generalisable to standard trading conditions.
Avoid launching new tests in the two weeks before and after major trading events. Build these blackout periods into your calendar explicitly. Seasonal categories, such as gifting or summer apparel, require additional care: testing a product page in off-peak season produces data about a low-intent audience that may not reflect demand-period behaviour.
Statistical significance thresholds of 95% are commonly cited, but statistical significance is not the same as practical significance. A test can reach 95% confidence with an effect size too small to matter commercially. Always define a minimum detectable effect before launch: the smallest improvement that would be worth acting on.
As a minimum, run tests for full business cycles. For most e-commerce brands, that means at least two full weeks to capture weekday and weekend patterns. Four weeks is more reliable for brands with significant variation by pay cycle or month-end.
Stopping a test early because it is showing a positive result inflates false positive rates through a statistical effect called "peeking". Commit to a sample size and duration upfront and do not make decisions before reaching both thresholds. Free calculators are available from Optimizely and VWO.
A test showing a clear positive result on desktop and a negative result on mobile has not produced a clear winner. It has identified a segment interaction that needs to be understood before any decision is made.
Device-level segmentation should be part of every test analysis. Where results conflict, the options are: implement the change only for the winning device segment, investigate why mobile responded differently, or run a follow-up test for mobile with a device-appropriate variant.
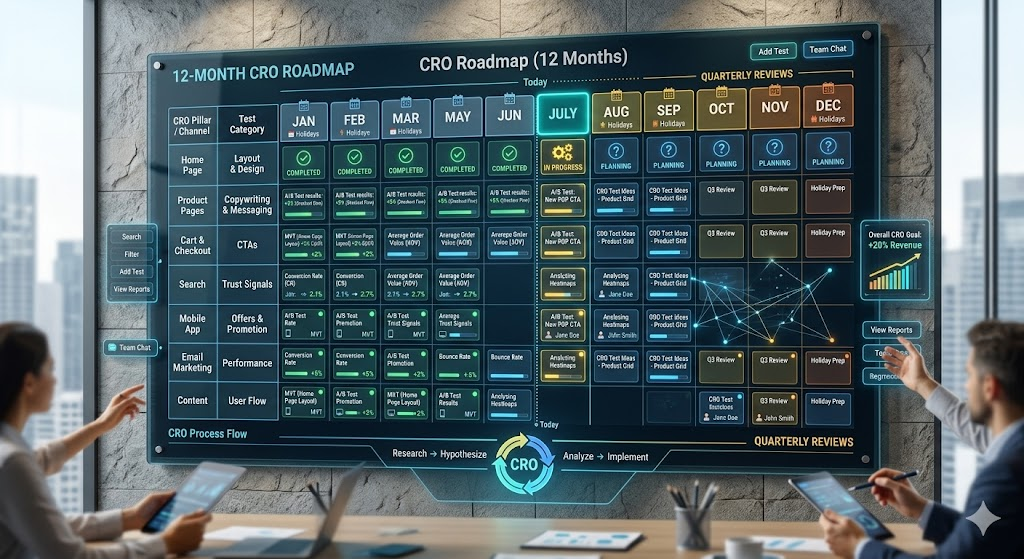
A 12-month testing roadmap gives structure to what can otherwise become an ad hoc programme. Balance high-impact areas such as checkout, product pages, and cart, which justify longer and more resource-intensive tests, against lower-friction areas like navigation and search, where faster tests can generate learning velocity.
Quarter one is best used to establish baselines, resolve known technical issues, and run high-confidence tests with strong research backing. Later quarters can incorporate more exploratory hypotheses as the team's understanding of the audience deepens.
The roadmap is a living document. New analytics data, customer feedback, and test results should feed back into the prioritisation backlog continuously. The Viaduct Generation blueprint process covers how we structure this kind of strategic planning, and the execution framework outlines how planned work is delivered consistently over time.
Testing too many variables at once collapses your ability to attribute results. Multivariate testing has its place, but it requires substantially more traffic to reach significance.
Ignoring segment-level results produces decisions that help one audience while harming another. Always slice by device, traffic source, and new versus returning visitor at minimum.
Declaring a winner too early is the most statistically costly mistake. Build governance into your programme that requires sign-off before stopping a test short of the pre-committed duration.
A testing calendar built around revenue per visitor and governed by proper statistical practice is the mechanism through which CRO becomes a genuine growth driver. The Viaduct Generation outcomes framework sets out how we connect testing activity to commercial results.

