
A lead scoring model is a set of rules that gives every prospect a number, so sales and fundraising teams spend their time on the people most likely to buy, enquire or give. The most dependable model for most B2B businesses, e-commerce brands and charities is a points-based model that combines two things: how well a lead fits your ideal customer, and how recently and how strongly they have engaged. Predictive models, which use machine learning, are the natural next step once you hold enough clean history. Whichever you choose, the model only works when sales agrees the threshold and the scores are reviewed against real outcomes.
This guide sets out the model types, a worked example, the criteria worth scoring, how HubSpot handles scores and how to adapt the approach if you are an online retailer or a charity. We also show where the work usually goes wrong, because that is where most scoring projects lose their value.
Research reviewing the field splits models into two families. In a peer-reviewed 2023 review of the literature, three traditional models are identified: spam filtering, rules or points-based scoring, and scorecards. The same review found 18 predictive models in the literature, with decision trees and logistic regression the most widely studied, and concluded that predictive models are expected to replace the traditional ones.
In practice, you will meet these approaches:
For a team with fewer than a few hundred conversions a year, a points-based model that mixes fit and engagement is the sensible starting point. Predictive scoring needs volume and consistent data capture to learn anything reliable, so treat it as a second phase rather than a first project.
The arithmetic is simple addition and subtraction. Oracle’s documentation, for instance, scores leads by job title, adding points for senior executives and fewer for operations managers, with a rules engine combining every rule into a single lead score attribute drawn from lead, campaign, company and contact data.
Here is an illustrative model for a UK B2B software business. The numbers are examples to adapt, not benchmarks.
| Signal | Type | Points |
|---|---|---|
| Director or head of department | Fit | +20 |
| Company of 50 to 500 employees | Fit | +15 |
| Target sector | Fit | +10 |
| Pricing page visit | Engagement | +8 |
| Demo request | Engagement | +25 |
| Content download | Engagement | +5 |
| Email click | Engagement | +3 |
| Personal email domain | Negative | -10 |
| No activity for 30 days | Decay | -10 |
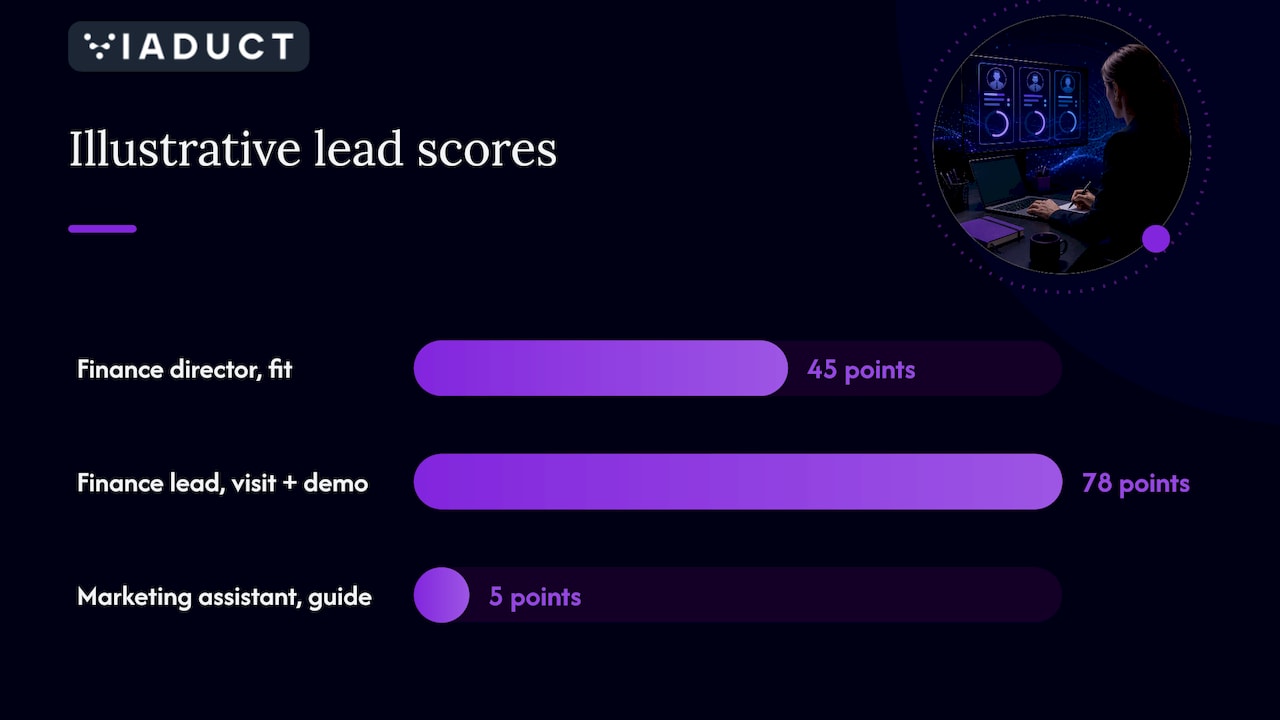
A finance director at a 200-person target-sector firm starts on 45 for fit alone. A pricing visit and a demo request take her to 78, and she is routed to a salesperson the same day. A marketing assistant at a two-person agency who downloads a guide scores 5, minus anything for poor fit, and stays in email nurture.
Two design choices matter more than any individual weighting. First, keep fit and engagement visible as separate scores as well as a total, so a highly active lead who is a poor fit does not reach a salesperson. Second, build in decay: engagement from months ago says little about intent today.
Start from the evidence in your own CRM, not from a generic list. Pull the last 20 to 50 closed-won deals and look for what they share before the first sales conversation: sector, size, the role of the first contact, the page or content that preceded the enquiry, the channel it came from. Weight those attributes highest.
Then add behaviours that show buying intent rather than general interest. Pricing, comparison, case study and integration pages usually signal more than blog reads. Repeat visits within a short window signal more than a single long session.
Finally, define the negatives. Disqualifying signals prevent sales from chasing people who were never going to buy, which is the quickest way to lose their trust in the model. If you want a fuller method for judging whether the leads you generate are worth pursuing, our lead quality scoring checklist walks through the measures that predict revenue.
The threshold is the score at which a lead moves from marketing to sales. Agree it jointly. If marketing sets it alone, it tends to be too low, and sales stops looking at the queue.
A workable process:
The test of a model is not the number it produces. It is whether salespeople are speaking to the right people at the right time and closing deals from the leads that were scored. If they are not, change the weights.
Many UK teams build their first model inside HubSpot. According to its documentation, lead scores assign numerical values to contacts, companies and deals based on property values and event actions. There are three score types: fit scores built from property groups, engagement scores built from event groups (with optional AI rules), and combined scores that use both while keeping separate total, fit and engagement properties.
The same page states that the default maximum score is 100 points, and that you can set custom limits ranging from -100 to 100 up to -10,000 to 10,000. That range is wide enough to model negatives and decay, but it is worth deciding the scale before you build, because changing it later alters every score in the database.
Once scores exist, use them: trigger workflows, create sales tasks above a threshold, and segment email by band. A score nobody acts on is only a column in a report. Our guide to email nurturing strategy shows how to design the sequences that carry leads from the monitor band into the sales-ready band.
Predictive scoring estimates conversion likelihood from patterns in historic data, including signals no one would think to write as a rule. It suits you when you have:
If your data is thin or inconsistent, a predictive model will learn the inconsistencies. Clean capture comes first, and a transparent points model teaches you which signals matter, which is exactly the groundwork a predictive model needs.
E-commerce. The “lead” is often an anonymous visitor or an email subscriber, so fit data is thin and behaviour dominates: product views, basket additions, repeat visits, email engagement and past order value. Scores usually feed lifecycle flows, such as a browse-abandonment sequence for warm profiles and a win-back flow once a score has decayed. Our work on email marketing in Klaviyo and HubSpot covers flows and automations of this kind.
Charities. Replace purchase intent with propensity to give or to take a specific action. Typical inputs are giving history, recency and frequency of gifts, event attendance, volunteering, and engagement with appeals. Major gift teams often add capacity to give and connection to the cause. The principle is the same: rank the list so that limited fundraising time and mailing budget go to the people most likely to respond, and let negative signals, such as lapsed contact or a preference not to be mailed, suppress the rest. Always respect consent and data protection rules when scoring supporters, and keep the scoring logic documented.
Lead scoring only pays back when it is tied to the whole acquisition system: the channels that create the leads, the funnel they move through and the revenue they produce. Our engagements run as fixed-scope 90-day sprints with defined deliverables, and our services include funnel mapping and analysis, lifecycle strategy, A/B testing and revenue attribution, so scoring rules can be built from how your buyers actually move through search, paid and email. If you want a model that sales will trust, see how our services fit together or read about our optimisation approach.
There is no universal number, because every model uses its own scale. A good score is one that reliably separates leads that became customers from those that did not. Test your threshold against historic closed deals and adjust it using sales feedback.
Scoring usually reflects behaviour and engagement, while grading reflects fit with your ideal customer. Many teams keep both as separate values and combine them, so a lead needs sufficient fit and sufficient intent before it reaches sales.
Review rejection reasons and conversion by score band monthly, and recalibrate weights at least quarterly. Revisit the whole model when your offer, pricing, audience or channel mix changes.
Yes. A simple model with eight to twelve signals, a decay rule and one agreed threshold is enough to start. Most CRMs, including HubSpot, support it natively, and you can add sophistication as your data grows.

