
Measure lead quality by tracking revenue per lead and MQL-to-SQL conversion rate by source, then chasing the gaps those two numbers expose. Before anything else, confirm your CRM tracks each lead from its original source through to closed-won, then pull a 90-day cohort report broken down by source. Everything that follows in this article, scoring models, data hygiene, sales alignment, is built to make those two numbers trustworthy.
TL;DR:
- A healthy MQL-to-SQL conversion rate should be around 13%, with top teams reaching 25 to 35%, indicating better alignment between marketing and sales.
- Revenue per lead is the primary metric to evaluate lead quality, as it directly links marketing efforts to actual revenue outcomes.
- Building a scoring system involves assessing firmographic fit, behavioural signals like demo requests, and negative signals such as personal email domains, with thresholds tested against historical closed-won deals.
- Data quality issues, including stale contact information and invalid leads from bots, can significantly distort performance metrics and should be addressed through validation and regular refreshes.
- Automating lead routing only after manual validation of scoring models and establishing clear roles and SLAs between marketing and sales enhance lead quality measurement effectiveness.
Lead quality measurement is the practice of tracking a small set of metrics that show whether the leads entering your pipeline actually convert into revenue, not just activity. Most marketing teams still report on volume: leads generated, cost per lead, form fills. None of those numbers tell you whether the leads were any good.
The standard industry term for this discipline is lead scoring and qualification analysis, and it sits at the intersection of marketing operations and sales enablement. You’re building a system that separates leads worth a salesperson’s time from leads that waste it. Get this right and you shorten sales cycles, cut wasted spend, and give your sales team a reason to trust marketing’s handoffs. Get it wrong, and you’ll keep optimising for the wrong signal, more leads, when what the business actually needs is better ones.
The metrics below aren’t a wishlist. They’re the minimum diagnostic set that most B2B teams need to know whether lead quality is improving or quietly rotting.
MQL-to-SQL conversion rate is the percentage of marketing-qualified leads that sales accepts as sales-qualified. Formula: (SQLs ÷ MQLs) × 100. A healthy rate sits around 13% for many B2B companies, with strong teams reaching 25 to 35%, according to HubSpot’s benchmarking data. If your rate is significantly lower, either your scoring model may be too permissive or sales may be rejecting leads for reasons marketing has not evaluated.
Cost per qualified lead (CPQL) divides total campaign spend by the number of leads that pass your qualification bar, not raw leads. This is the number that stops teams celebrating a cheap-but-useless lead source.

Revenue per lead (RPL) divides closed-won revenue attributed to a source by the total number of leads that source generated. Prospeo positions RPL as the single north-star metric because it’s the only figure that ties marketing activity directly to money, everything else is diagnostic.
Contact rate, speed-to-lead (time from form fill to first outreach), lead-to-opportunity rate, and lead-to-close rate round out the set.
Quick benchmark: Industry averages for MQL-to-SQL conversion tend to cluster near 15%, but the spread between the weakest and strongest teams is wide enough that a single percentage point of improvement can represent real pipeline value.
Check contact rate and speed-to-lead daily, they’re volatile and cheap to monitor. Review cohort conversion weekly. Reserve RPL and CPQL for a monthly outcome dashboard, since revenue attribution needs time to mature.
Turning metrics into action means building a scoring model, testing thresholds against real outcomes, and tracking each cohort back to revenue. Here’s a version you can build in a spreadsheet before you touch any automation platform.
Start with a 0 to 100 point model split across three categories:
Set an initial threshold, say 60 points for MQL and 80 for SQL, then test it against your last 12 months of closed-won deals. Find the score percentile that actually correlates with wins and set your SQL threshold there rather than at a round number you picked by instinct. Recalibrate quarterly as your product, market, or ideal customer profile shifts.
Once thresholds are set, build cohort reports by source and campaign. Each cohort should show CPQL, RPL, MQL-to-SQL rate, and time-to-close, so you can compare a LinkedIn campaign against a content-syndication vendor on identical terms.
A one-week implementation checklist:
Pro Tip: Run your scoring model manually for 30 days before switching on automation. WhatConverts recommends this exact window because it’s long enough to catch seasonal noise but short enough to course-correct before a bad model does real damage to sales trust.
Bad data doesn’t just sit quietly in your CRM, it actively corrupts every metric built on top of it. Stale email addresses inflate your invalid-contact rate. Bot submissions from scraper traffic pad your lead count while contributing nothing to revenue. Mis-attributed sources make one channel look brilliant and another look worthless when the truth is somewhere in between.
Contact data decays faster than most teams assume. Roughly a tenth of B2B contact records change within a year according to practical industry analysis, through job changes, email migrations, and company moves. If you’re not refreshing records, your speed-to-lead metric might be accurate while your contact rate quietly collapses.
Fix the foundation with a handful of capture controls:
ActiveProspect’s research on capture-side filtering makes a sharp point here: if invalid leads reach your CRM before you catch them, they contaminate every optimisation decision built on that data, your scoring model included.
Refresh contact data monthly at minimum, weekly if a lead is actively moving through your pipeline. Track data health with three numbers: bounce rate, duplicate rate, and invalid-contact rate. If any of these trend upward month over month, your quality metrics upstream are no longer measuring what you think they’re measuring.
Pro Tip: Before you question whether a lead source is genuinely underperforming, check its invalid-contact rate first. A source generating cheap, plentiful, but poorly validated leads will always look worse than it should.
An MQL (marketing-qualified lead) has shown enough behavioural or firmographic fit to warrant sales attention. An SQL (sales-qualified lead) has been vetted by sales and accepted into active pursuit. The often-missed middle step is the SAL (sales-accepted lead), the moment sales formally acknowledges receipt of a lead before deciding whether to pursue it. Without a shared definition of all three, marketing and sales end up arguing about numbers that were never measuring the same thing.
This is where most lead-quality programmes quietly fail, not on the maths, but on governance. Salesforce’s guidance on the MQL-to-SQL handoff emphasises that speed and clarity at this handoff point are what separate teams with healthy conversion from teams that lose leads to silence.
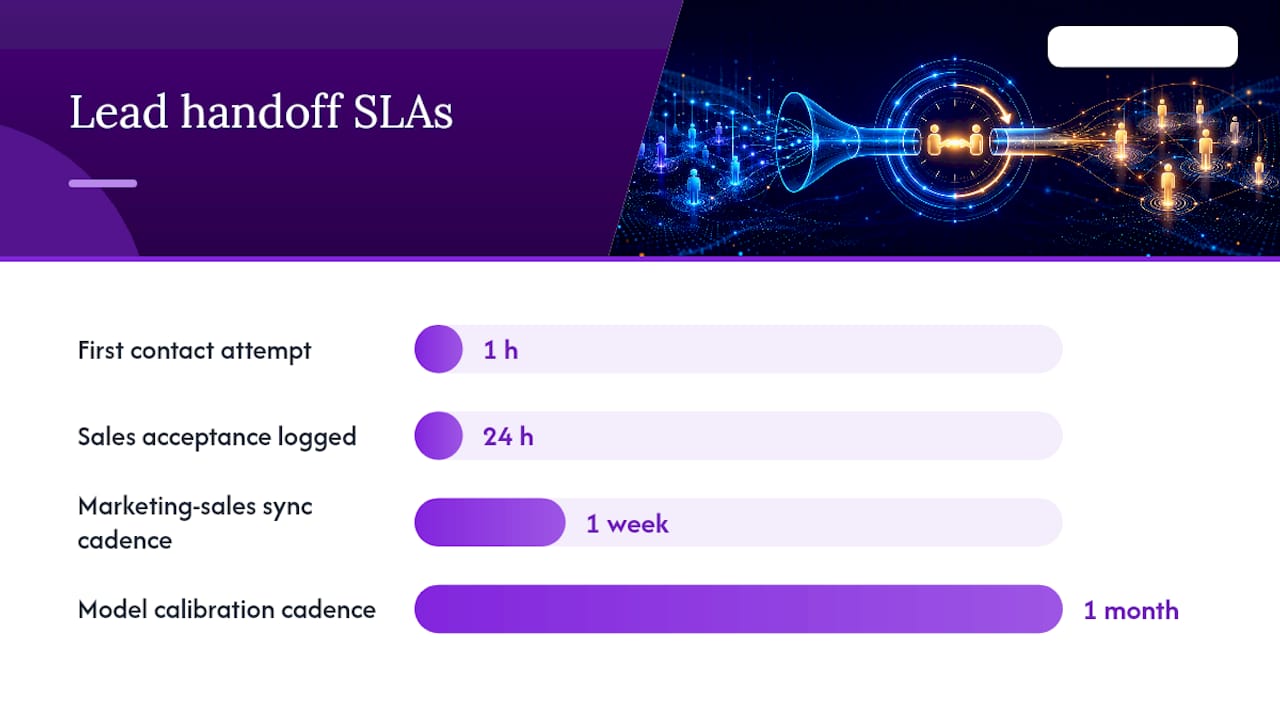
Set explicit SLAs and track compliance against them:
Build a feedback loop around those rejection codes. When sales rejects a batch of leads for “bad fit,” marketing should be adjusting the firmographic scoring weights within the week, not the quarter. A short weekly sync between marketing and sales operations catches immediate SLA breaches, while a monthly calibration session, recommended by several practitioner guides, keeps the scoring model itself from drifting out of alignment with what’s actually closing.
Assign three roles clearly: a measurement owner who maintains the dashboards, a data owner who’s accountable for CRM hygiene, and a score steward who owns threshold changes and can veto ad hoc adjustments nobody’s tested. Without named owners, “we should fix that” becomes nobody’s job. Our pipeline marketing playbook covers how to structure these shared KPIs between the two teams in more depth.
Our five-phase Growth Engine maps directly onto the measurement work this article describes, because lead quality isn’t a reporting exercise, it’s a system that has to be built, tested, and governed. AI-Powered Intelligence establishes the baseline data and historical closed-won patterns. Strategic Blueprint sets scoring thresholds and SLA definitions. AI-Amplified Execution routes and scores leads in near real time. Human-Led Optimisation is where strategists override the model when a pattern the algorithm can’t yet see starts to matter. Measurable Commercial Outcomes closes the loop back to revenue.
The KPIs prioritised reflect the same hierarchy this article has argued for throughout:
AI augments the scoring layer by surfacing behavioural patterns across a far larger dataset than any single analyst could review manually, but it’s directional. Every model is validated against actual closed-won outcomes before it is trusted to route leads unsupervised.
Pro Tip: If your team can’t yet answer “what’s our MQL-to-SQL rate by source” without a manual spreadsheet exercise, that’s the signal to consider outsourcing the build. In-house capability makes sense once the system exists, getting there quickly is where an experienced partner earns its cost.
If the checklist above feels like a lot to build while running a full marketing calendar, considering external help can close that gap. Typical engagements run as 90-day sprints with defined commercial targets, built around the exact outcomes this article has argued for: cleaner pipeline attribution, a working revenue-per-lead figure, and MQL-to-SQL conversion that sales trusts.
What makes the approach different is that it is AI-native rather than AI-assisted, the delivery model, from historical data analysis through to score calibration and routing, runs on proprietary infrastructure, but every threshold and model is checked by strategists against actual closed-won history before going live. This combination gives mid-market and scale-up teams the depth of a larger analytics function without the overhead of building one internally. The revenue attribution approach explains the methodology, and pages on using AI in client work show how AI shapes this work in practice. For teams weighing SLA structures against formal sales training, Corporate Sales Pro’s course is a useful complement to the operational alignment work described above.
For benchmark figures on MQL-to-SQL conversion and handoff definitions, HubSpot’s guide remains the clearest reference. For a copyable scoring checklist and the manual-to-automated scoring path, see WhatConverts. Prospeo’s practical framework is worth reading for its case on revenue per lead as a north-star metric, and ActiveProspect covers capture-side validation in more technical depth than most marketing-led guides attempt.
Look at behavioural signals (pricing page visits, demo requests), firmographic fit (company size, job title, industry), and downstream outcomes like MQL-to-SQL conversion rate and revenue per lead by source, rather than relying on lead volume or cost alone.
An MQL is a marketing-qualified lead that shows enough fit and intent to warrant sales attention, while an SQL is a sales-qualified lead that a salesperson has vetted and accepted into active pursuit; the gap between the two rates, typically averaging around 13 to 15%, is one of the clearest health signals in the funnel.
The 5-minute rule holds that contacting a new lead within five minutes of submission dramatically improves the odds of a successful connection compared with waiting even an hour, which is why speed-to-lead is tracked as a leading indicator rather than an outcome metric.
A good-quality lead matches your firmographic ideal customer profile, shows high-intent behaviour such as pricing or demo activity, passes basic data validation checks, and, most importantly, has a demonstrated tendency within its source cohort to convert into revenue.
Review contact rate and speed-to-lead daily, run cohort conversion reviews weekly, and recalibrate scoring thresholds against closed-won data on a quarterly basis so the model doesn’t drift away from what’s actually closing.

