
Predictive modelling is the process of using historical data, statistical algorithms, and machine learning to forecast future outcomes. A UK high-street bank uses it to assess whether a loan applicant is likely to default. A local council uses it to predict which households will need social care support before a crisis point. A retailer uses it to decide how much stock to order before Christmas. These are not experimental applications; they are live, operational systems running across British institutions today.
The term sits under the broader umbrella of predictive analytics, which covers the full pipeline from raw data to actionable forecast. Predictive modelling is specifically the mathematical and computational layer of that pipeline: the model itself, how it is built, and how its outputs are validated before they influence real decisions.
Predictive modelling uses historical data and statistical algorithms to forecast future outcomes, and its value depends entirely on data quality, honest validation, and human oversight at the point of decision.
| Point | Details |
|---|---|
| Definition | Predictive modelling uses historical data and algorithms to forecast future categorical or continuous outcomes. |
| Core model types | Classification predicts categories; regression predicts numbers; time-series methods handle sequential data. |
| Model lifecycle | Eight steps from problem definition to monitoring; data leakage and poor feature engineering are the most common failure points. |
| Evaluation matters | Choose metrics that match the cost of each error type; cross-validation gives more reliable estimates than a single train/test split. |
| Ethics and regulation | UK GDPR Article 22 governs automated decisions; audit for bias across subgroups and document a DPIA before deployment. |
Predictive models fall into two broad categories: classification models, which predict a categorical outcome, and regression models, which predict a continuous numerical value. A fraud detection system classifying transactions as “fraudulent” or “legitimate” is a classification problem. A model estimating next month’s energy consumption in kilowatt-hours is a regression problem.
The learning approach matters just as much as the output type. Supervised and unsupervised learning represent the two main camps:
Predictive modelling sits within the broader predictive analytics discipline, which draws on data mining, statistical modelling, machine learning, and artificial intelligence to turn current data into forward-looking insight.
Choosing the right algorithm is less about picking the most sophisticated option and more about matching complexity to the problem. Here is a practical map of the techniques you will encounter most often.
Linear and logistic regression are the natural starting points. Linear regression predicts a continuous output (house price, revenue). Logistic regression predicts a probability of a binary outcome (churn: yes or no). Both are fast to train, easy to interpret, and often surprisingly competitive on clean, well-structured data.
Decision trees split data into branches based on feature values, producing a model you can literally draw and explain to a non-technical stakeholder. They overfit easily on their own, but they form the building blocks of more powerful ensemble methods.
Random forest builds hundreds of decision trees on random subsets of the data and averages their predictions. The ensemble approach reduces overfitting and handles missing values reasonably well, making it a reliable default for many classification and regression tasks.
Gradient boosting (XGBoost, LightGBM) builds trees sequentially, each one correcting the errors of the last. It tends to outperform random forest on tabular data but requires more careful tuning and is harder to explain to a business audience.
Neural networks, implemented in frameworks such as TensorFlow or PyTorch, excel at unstructured data: images, text, audio. For structured tabular prediction tasks, they rarely beat well-tuned gradient boosting, and they demand far more data and compute.
K-means clustering is the go-to unsupervised technique for segmentation. It groups observations into k clusters by minimising within-cluster variance. Retail marketers use it to segment customers; councils use it to identify neighbourhoods with similar service-demand profiles.
ARIMA and ETS are purpose-built for time-series data. ARIMA (AutoRegressive Integrated Moving Average) models trends and seasonality in sequential data. ETS (Error, Trend, Seasonality) is often easier to tune automatically and performs well on shorter series.
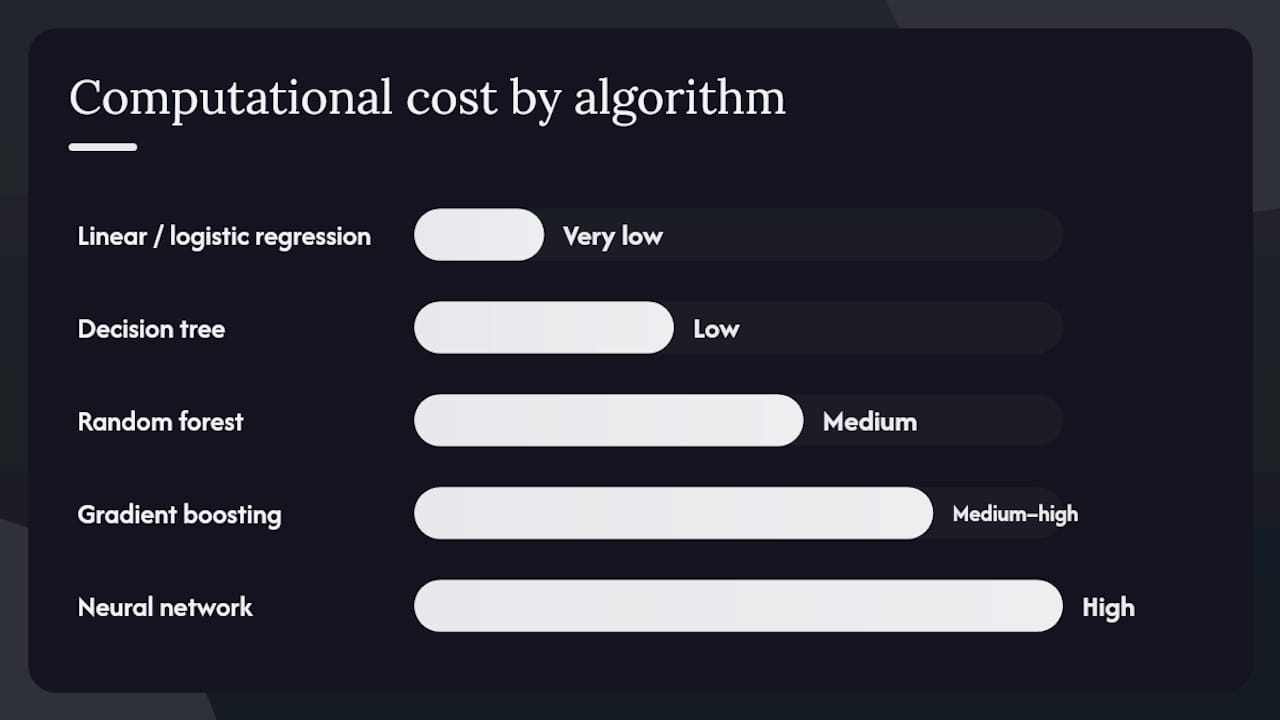
The table below summarises the key trade-offs across these techniques.
| Algorithm | Best for | Interpretability | Data requirement | Computational cost |
|---|---|---|---|---|
| Linear / logistic regression | Structured tabular data, baselines | High | Low | Very low |
| Decision tree | Explainable classification / regression | High | Low–medium | Low |
| Random forest | General-purpose classification / regression | Medium | Medium | Medium |
| Gradient boosting | High-accuracy tabular prediction | Low–medium | Medium | Medium–high |
| Neural network | Images, text, complex patterns | Low | High | High |
| K-means clustering | Customer / geographic segmentation | Medium | Medium | Low–medium |
| ARIMA / ETS | Time-series forecasting | Medium | Medium (sequential) | Low |
The core principle: start simple. A logistic regression that a stakeholder can interrogate is often more valuable in practice than a gradient-boosting model that nobody trusts.
Predictive modelling follows an iterative process of building, testing, and validating until the model meets a defined accuracy threshold, then deploying and monitoring it continuously. The steps below are sequential but rarely linear; you will loop back, especially between feature engineering and training.
Pro Tip: Guard against data leakage from the start. Leakage occurs when information from the future (or from the target variable itself) accidentally enters the training features, producing a model that looks brilliant in testing and fails in production. The most common culprit is feature engineering that uses the full dataset before the train/test split.
Keeping a human in the loop at the deployment stage is not a sign of distrust in the model. Public-sector projects in particular have shown that models fail not because of flawed mathematics but because of poor data integration and the absence of human judgement when interpreting outputs.

Picking the right metric depends entirely on what the model is trying to do and what kind of error is most costly.
For classification models:
For regression models:
Validation techniques determine how trustworthy your metric estimates are:
A short validation checklist worth running before any model goes live: confirm the test set was never used during tuning; check that performance metrics are consistent across demographic subgroups; verify that feature distributions in the training data match the production environment; and test the model’s behaviour on edge cases and out-of-distribution inputs.
Overfitting (the model memorises training data and generalises poorly) and underfitting (the model is too simple to capture the signal) are the two failure modes to watch. Cross-validation scores that are much higher than test-set scores signal overfitting. Uniformly poor scores across both signal underfitting.
Predictive modelling helps organisations across finance, healthcare and retail to forecast outcomes and improve decision-making. The UK examples below show the range of practical applications.
A model trained on historical data will reproduce the patterns in that data, including discriminatory ones. A credit-scoring model trained on decades of lending decisions will reflect the biases embedded in those decisions. The consequences are not abstract: people can be denied loans, housing, or social support based on outputs that a model cannot explain and a human cannot easily challenge.
Practical mitigation steps include:
In the UK, the Information Commissioner’s Office (ICO) provides guidance on automated decision-making under UK GDPR. Article 22 of UK GDPR gives individuals the right not to be subject to solely automated decisions that produce significant legal or similarly significant effects. Any model that feeds directly into such decisions requires a documented lawful basis, a human review mechanism, and the ability to explain the decision to the individual affected.
Pro Tip: Before deploying any model that affects individuals, run a Data Protection Impact Assessment (DPIA) with your legal or compliance team. The ICO’s DPIA guidance is freely available and sets out exactly what you need to document.
Viaductgen applies predictive modelling directly within client growth programmes, most visibly in experiment selection and audience targeting. Rather than running A/B tests on an equal-traffic split and waiting for statistical significance, predictive models are used to prioritise which experiments are most likely to produce a conversion uplift before a single visitor is exposed to the variant. The model draws on historical test outcomes, page-level engagement signals, and audience segment data to rank candidate experiments by expected value.
The practical outcome is a faster test cycle and a higher proportion of winning experiments reaching significance. Across client engagements, this approach consistently reduces the number of inconclusive tests that consume traffic without generating learning.
For audience targeting, classification models score CRM contacts and site visitors by propensity to convert, enabling paid media budgets to concentrate on the highest-value segments rather than broad demographic proxies. This is particularly effective in reducing cost per acquisition on Google and Meta campaigns where audience signals are rich but noisy.
Pro Tip: For marketers new to predictive modelling, the highest short-term return usually comes from a churn or propensity model applied to an existing CRM dataset. You already have the data; the model just surfaces the signal that human review misses at scale.
Viaductgen’s AI in client work approach integrates these models within a broader growth system, connecting predictive outputs to search, paid media, and conversion rate optimisation in a single accountable pipeline.
The tools you need are free and widely used. The learning path is well-documented. The main barrier is starting.
Languages and libraries:
A practical learning path:
The Government Analysis Function’s predictive analysis learning pathway is one of the most practically structured free resources available to UK learners, covering the full journey from statistical foundations to deployment considerations.
For those exploring how to apply these skills in a consultancy context, resources on AI consulting for smaller organisations offer a useful bridge between technical learning and commercial application.
Predictive modelling uses historical data and mathematical algorithms to estimate the likelihood of a future outcome, such as whether a customer will churn or whether a loan will default.
Predictive analytics is the broader discipline covering data collection, processing, and decision-making; predictive modelling is the specific step of building and validating the mathematical model that generates the forecast.
Not in the structured-data sense. Large language models like ChatGPT are generative systems trained to predict the next token in text; predictive AI models, by contrast, forecast quantitative or categorical outcomes from structured historical data.
A UK bank’s credit-scoring system is a classification model that predicts the probability of loan default based on an applicant’s financial history, producing a score that informs the lending decision.
The foundations are accessible with basic statistics and Python or R knowledge. The harder challenges are practical: sourcing clean data, engineering useful features, and validating models honestly rather than optimistically.

