
Outcome measurement is the practice of tracking the commercial results of your marketing and growth activity — revenue, pipeline, conversions, and ROI — so you can judge which investments are working and optimise accordingly. It is not about counting clicks or impressions. It is about proving, in numbers your CFO recognises, that marketing drives business growth.
This guide covers:
Outcome measurement converts marketing from a cost centre into a provable revenue driver by tying every KPI to pipeline, profit, or commercial retention.
| Point | Details |
|---|---|
| Define commercial KPIs first | Set your north-star KPI (revenue, pipeline, or POAS) before selecting any tactical metrics. |
| Layer your measurement methods | Combine attribution, MMM, and incrementality testing for a complete, privacy-safe picture. |
| Replace ROAS with POAS | POAS accounts for margins and returns, giving finance a defensible view of marketing profit. |
| Run a 90-day sprint | Five steps from north-star KPI to live dashboard; assign a named data owner on Day 1. |
| Viaductgen accelerates this | Viaductgen’s AI-native Growth Engine delivers revenue attribution and measurement infrastructure inside a structured sprint. |
Marketing without measurement is a cost centre. Marketing with rigorous outcome measurement becomes a predictable revenue lever — and that distinction changes every budget conversation you have with finance.
When your KPIs map directly to revenue and pipeline, three things happen at a senior level. Budget allocation becomes evidence-based rather than political. Scenario planning gets grounded in real elasticity data. And cross-functional alignment improves because sales, finance, and marketing are finally reading from the same numbers.
BCG’s survey of senior measurement professionals found that leaders who standardise a shared KPI framework and integrate MMM, incrementality testing, and multi-touch attribution together are more likely to achieve materially higher revenue growth than peers who rely on a single method.
The digital marketing challenges facing growth teams in 2026 make this more urgent, not less. Privacy constraints, fragmented channels, and compressed buying journeys mean activity metrics are less reliable than ever.
Pro Tip: Present a one-page measurement summary to your finance director every month, not quarterly. Show pipeline influenced, cost per opportunity, and POAS alongside spend. Monthly visibility protects the marketing budget when trading conditions tighten.
| Outcome | Primary KPI | Calculation note |
|---|---|---|
| Revenue | Monthly recurring revenue (MRR) / total revenue attributed | Sum of closed revenue where marketing touched the journey |
| Pipeline | Marketing-qualified pipeline value | Opportunities created × average deal value |
| Conversions | Conversion rate by funnel stage | Conversions ÷ sessions or leads at each stage |
| Retention | Customer retention rate / churn rate | (Customers end of period ÷ start) × 100 |
| Brand lift | Aided awareness / share of search | Survey delta or branded search volume trend |
| Profitability | Profit on Ad Spend (POAS) | (Revenue from ads − cost of goods − ad spend) ÷ ad spend |
ROAS (Return on Ad Spend) is the metric most paid media teams default to, and it is often the wrong one. Avinash Kaushik argues that ROAS ignores margins, fulfilment costs, and returns, giving finance a misleadingly optimistic picture. POAS or ROI, which account for actual profit, are far more defensible in a board conversation.
Micro and macro KPIs to track across the funnel:
Pro Tip: Derive your KPI targets from 12 months of historical data first, then benchmark against sector norms. A target set without a baseline is a guess. A target set against your own trend line is a commitment.
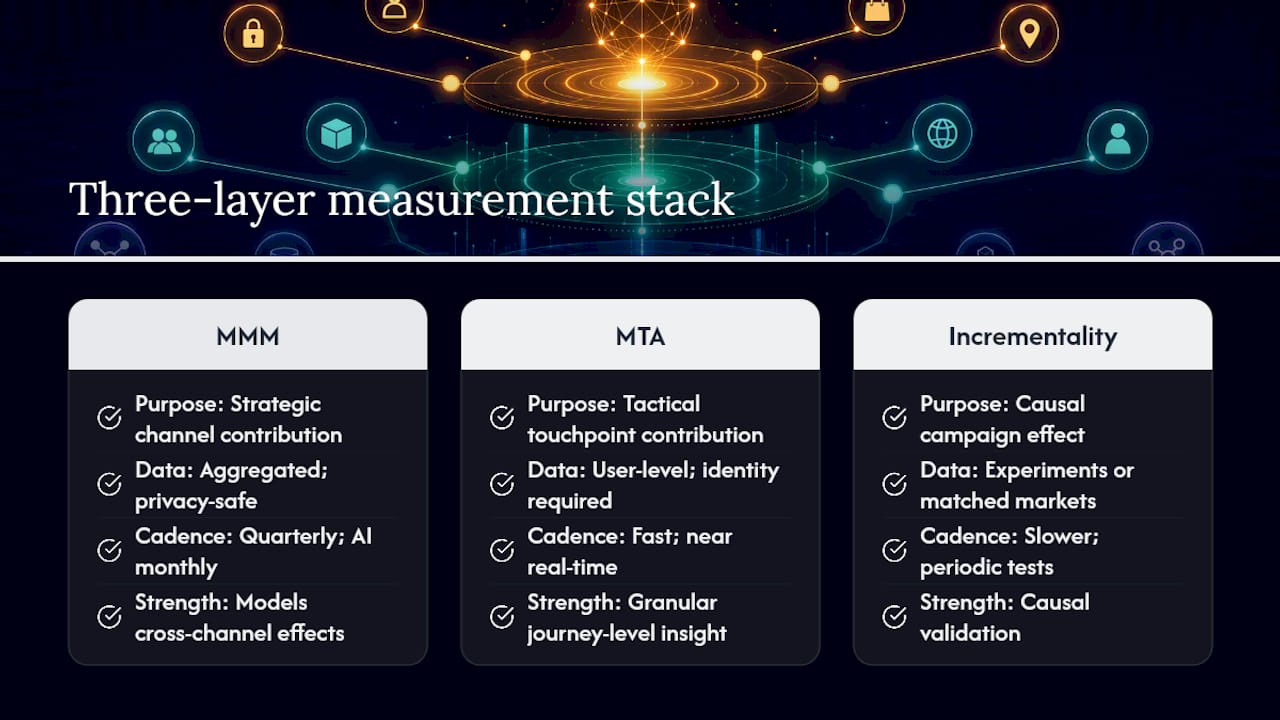
No single method answers every question. The most reliable measurement systems layer three approaches, each solving a different problem.
Marketing mix modelling (MMM) answers the strategic question: which channels drive revenue over time, and what is the cross-channel effect? MMM uses historical spend and outcome data to model channel contribution without relying on cookies or individual tracking. It runs on aggregated data, which makes it privacy-safe by design. The trade-off is cadence: traditional MMM updates quarterly, though AI-assisted models can run monthly.
Multi-touch attribution (MTA) answers the tactical question: which touchpoints in a specific customer journey contributed to a conversion? It is granular and fast, but it depends on identity resolution across sessions and devices. As third-party cookies continue to deprecate, MTA gaps widen unless you have a strong first-party data layer. Viaductgen’s approach to connecting content to pipeline uses MTA to tie SEO and content activity directly to commercial outcomes.
Incrementality testing answers the causal question: did this campaign actually cause the outcome, or would it have happened anyway? Geo-holdout tests and matched-market experiments are the gold standard. They are slower to run but they calibrate both MMM and MTA, removing the attribution inflation that inflates every channel’s reported contribution.
Google’s modern measurement playbook recommends combining all three as a unified, privacy-first approach. MMM sets strategic direction, incrementality validates causality, and attribution optimises day-to-day spend.
Pro Tip: Start with attribution and one incrementality test per quarter. Add MMM once you have 18 months of clean spend and outcome data. Trying to run all three simultaneously without the data infrastructure to support them produces noise, not insight.
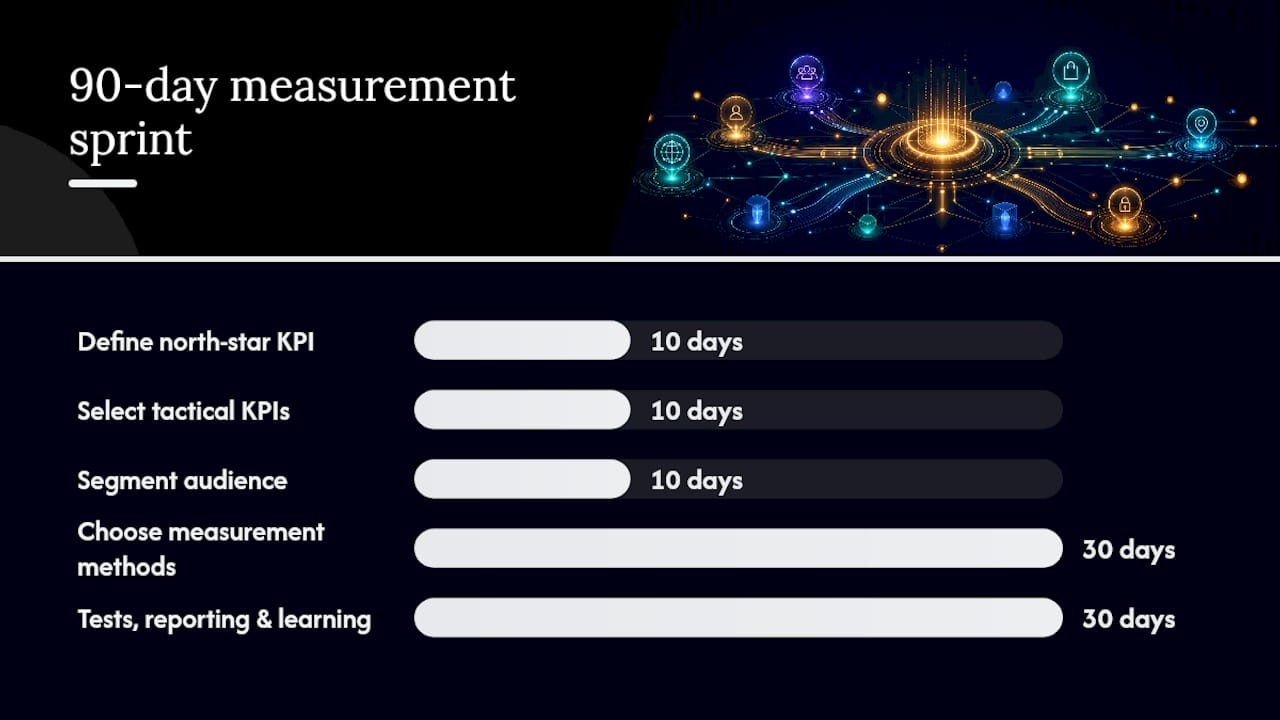
Kaushik’s Digital Marketing and Measurement Model provides the structural logic: define outcomes before you select metrics, and select metrics before you build dashboards. The five steps below follow that sequence, mapped to a 90-day sprint.
Sample dashboard fields to ship by Day 90: north-star KPI (actual vs. target), pipeline by source, CPA by channel, POAS, experiment status (running / complete / planned), and data quality flag.
Pro Tip: Assign a named data owner for each KPI on Day 1. Measurement systems fail at the governance layer, not the technical one. If nobody owns the number, nobody fixes it when it breaks.
Reliable outcome measurement rests on six capability layers:
In the UK context, first-party data strategy is not optional. With the ICO’s enforcement of UK GDPR and the ongoing deprecation of third-party identifiers, organisations that have not built consent-based data collection are already running blind on a growing share of their audience. Measuring SEO performance through first-party signals, branded search trends, and pipeline attribution is one practical way to maintain visibility as cookie-based tracking contracts.
Pro Tip: You do not need all six layers on Day 1. A clean CRM, GA4 with server-side tagging, and a simple attribution model in a spreadsheet will outperform a sophisticated stack built on dirty data.
The most expensive measurement mistake is not a broken dashboard. It is measuring the wrong thing with precision. A team that optimises ROAS to 8x while destroying margin is doing exactly that.
Quick fixes by timeframe:
| Review | Cadence | Attendees | Focus |
|---|---|---|---|
| Performance pulse | Weekly | Marketing team | Leading indicators, data quality, experiment status |
| Commercial review | Monthly | CMO, finance director | North-star KPI, pipeline, POAS, budget pacing |
| Strategic review | Quarterly | CMO, CEO, CFO | MMM outputs, channel mix, scenario planning, LTV trends |
Dashboard template (minimum viable fields): north-star KPI actual vs. target, pipeline by source and stage, CPA by channel, POAS, brand lift trend, experiment backlog with status, and a data quality indicator.
Governance checklist:
Pro Tip: Treat your measurement system as a product. Give it a roadmap, a backlog, and a quarterly review. Teams that treat it as a one-time setup project find it decays within six months.
Most mid-market teams know they need better measurement. The gap is usually not ambition — it is the time and infrastructure to build it without dropping everything else.
Viaductgen’s five-phase Growth Engine moves organisations from activity metrics to revenue attribution inside a structured 90-day sprint. Senior strategists handle discovery, KPI alignment, attribution configuration, and MMM integration, drawing on cross-client intelligence from 50+ engagements to set benchmarks no single business could build internally. The result is a measurement system that speaks finance’s language from day one.
To see how AI is embedded in every stage of client work, or to start a discovery conversation about your measurement sprint, get in touch with the Viaductgen team.
Outcome measurement is the practice of tracking commercial results — revenue, pipeline, conversions, and ROI — to judge whether marketing investments are generating real business growth, rather than just activity.
Activity metrics (clicks, impressions, follower counts) do not connect to profit. Outcome measurement gives finance and the board a credible, auditable view of marketing’s contribution to revenue and pipeline.
Profit on Ad Spend (POAS) measures profit generated per pound of ad spend after deducting cost of goods and fulfilment. Unlike ROAS, it reflects actual margin, making it a far more reliable KPI for budget decisions.
MMM models long-term channel contribution at a strategic level; attribution tracks individual customer journeys tactically; incrementality testing validates causality by measuring true lift. Used together, they produce a complete and privacy-safe measurement picture.
Viaductgen builds revenue attribution and measurement infrastructure inside a 90-day sprint, using AI models and cross-client benchmarks to move organisations from activity metrics to commercial KPIs quickly.

