
Brand equity is the extra commercial value a brand name adds to a product or service, over and above what the product itself would be worth without it. It lives in the minds of consumers — in their perceptions, associations, and feelings — and it converts directly into pricing power, repeat purchase, resilience during downturns, and measurable contribution to a business’s overall valuation.
That last point matters more than most executives realise. A business with strong brand equity can charge more, spend less to acquire customers, and weather a crisis that would permanently damage a weaker brand. The CIM describes brand equity as accumulated commercial value built on consumer perceptions, thoughts and feelings rather than product features alone. That framing is the right starting point.
Brand equity is not the same as brand awareness, and it is not the same as brand identity. Conflating them is one of the most common strategic errors in marketing.
Think of it as a brand association network — a web of meanings, experiences, and emotions that determine choice when two products sit side by side on a shelf. Two academics defined the canonical frameworks that practitioners still use today: David A. Aaker, whose asset-based model breaks equity into five measurable components, and Kevin Lane Keller, whose Customer-Based Brand Equity (CBBE) pyramid maps the consumer journey from awareness to resonance. Both are covered in detail below.

The commercial case is direct. Strong brand equity produces five measurable outcomes:
Consider the UK retail context. John Lewis has spent decades building associations around quality, trust, and the famous “never knowingly undersold” promise (recently updated, but the underlying equity remains). That equity means shoppers pay a premium over comparable products elsewhere and return even when cheaper alternatives exist. Marks & Spencer’s food halls command prices well above supermarket own-label equivalents — not because the ingredients are categorically different, but because the brand signals quality and occasion. Tesco, by contrast, competes partly on price but has built equity through the Clubcard loyalty scheme, which converts transactional behaviour into preference data and repeat purchase. Nike’s brand equity is visible in its ability to sell a £150 trainer when a functionally equivalent shoe costs £40. Starbucks charges £5 for a coffee that costs a fraction of that to produce — the price premium is a direct financial expression of equity.
The distinction between equity (perception) and realised brand value (financial outcome) matters here. Equity is the cause; brand value, as calculated by firms such as Brand Finance, is the effect expressed in pounds.
David A. Aaker identified five assets that constitute brand equity. The first four are consumer-facing; the fifth is structural.
Keller’s model builds from the bottom up: salience (do consumers know who you are?), performance and imagery (what do they think and feel?), judgements and feelings (how do they evaluate you?), and finally resonance (do they feel a deep, active loyalty?). The canonical components — awareness, associations, perceived quality, and loyalty — map directly onto Keller’s levels.
| Component | What it predicts | Illustrative brand behaviour |
|---|---|---|
| Brand awareness | Top-of-funnel traffic, consideration | Nike’s “Just Do It” omnipresence |
| Brand associations | Category preference, occasion purchase | Starbucks = morning ritual |
| Perceived quality | Price premium, NPS | Apple’s premium pricing across product lines |
| Brand loyalty (attitudinal) | Repeat purchase, advocacy, NPS | John Lewis’s customer return rate |
| Brand loyalty (behavioural) | Retention, lower churn | Tesco Clubcard repeat visits |
| Proprietary assets | Competitive moat, licensing revenue | Nike’s Swoosh trademark |
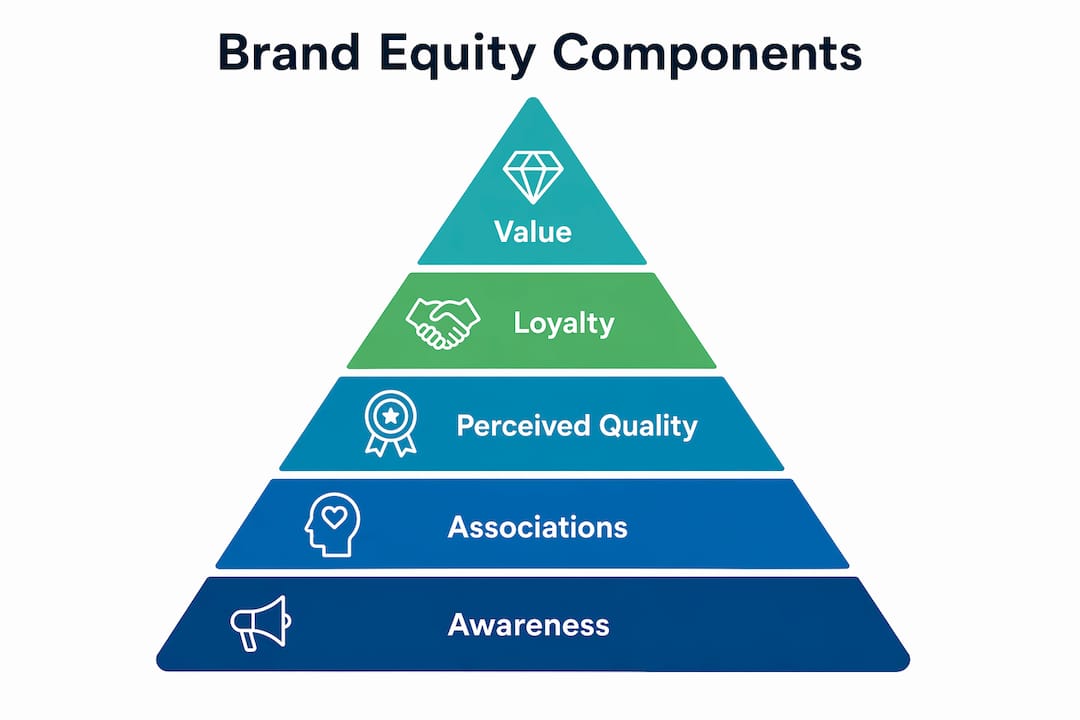
Building equity is sequential. Trying to jump straight to emotional resonance without functional salience almost always fails — consumers cannot feel loyal to a brand they cannot recall.
Pro Tip: When budgets are limited, prioritise awareness and one or two core associations before investing in loyalty mechanics. Loyalty built on weak awareness is fragile — it depends on the customer never encountering a better-known alternative.

Measurement runs on two parallel tracks: consumer metrics and financial metrics. Neither alone tells the full story.
Price premium is the single most direct financial measure of equity — it shows what consumers are willing to pay purely for the brand name. Tracking it quarterly alongside NPS gives a fast read on whether equity is holding or eroding.
Practitioners should restrict their core scorecard to 8–12 quarterly metrics across awareness, perception, preference, and financial impact. More than that and the data becomes noise. Monthly or quarterly review of brand equity scorecards materially improves early detection of sentiment shifts.
| Metric | What it shows | How to collect (UK context) | Commercial KPI linked |
|---|---|---|---|
| Unaided awareness | Salience in category | YouGov or Kantar omnibus survey | Top-of-funnel traffic |
| Brand preference | Competitive position | Kantar BrandZ tracker | Conversion rate |
| Perceived quality | Price justification | Online survey panel | Price premium |
| NPS | Loyalty and advocacy | Post-purchase email survey | Retention, referral |
| Price premium | Financial equity expression | Retail price audit vs. category | Revenue per unit |
| Brand valuation | Total financial brand value | Brand Finance annual report | Business valuation |
Limit your core scorecard to between 8 and 12 key metrics, in line with practical industry recommendations.
Aligning survey and financial windows: a common reporting mistake is pairing survey data from one quarter with financial data from a different period. Fix the survey population and time window first, then attach financial metrics from the same window. Mismatched data produces false conclusions about what is driving commercial performance.
Strong equity is visible in behaviour, not just survey scores.
Weak equity has a recognisable signature: high awareness but low preference. A brand that everyone knows but few actively choose is not an equity problem — it is a perception problem, and the two require different interventions. Commoditised pricing is the clearest symptom: when a brand cannot hold a price premium against generic alternatives, equity has either never been built or has eroded. For a deeper look at how brand recognition relates to equity, the distinction between recall and preference is the key diagnostic.
Before/after pattern: a brand that moves from “known but not preferred” to “preferred and recommended” typically does so by sharpening its associations, not by increasing its advertising spend. The intervention is usually clarity of positioning, not volume of media.
On the legal side: brand equity built without registered trademark protection is vulnerable. In the UK, register trademarks with the Intellectual Property Office to protect the proprietary assets that underpin your equity before a competitor or bad actor exploits the gap.
| Component | Sample question | KPI threshold (indicative) |
|---|---|---|
| Unaided awareness | “Which brands in [category] come to mind first?” | Target: top-3 mention rate |
| Aided awareness | “Have you heard of [brand]?” | Baseline vs. wave-on-wave change |
| Brand associations | “Which words or phrases do you associate with [brand]?” | % linking target attributes |
| Perceived quality | “How would you rate [brand]'s quality vs. alternatives? (1–10)” | Score above category average |
| Brand loyalty | “How likely are you to recommend [brand]?” | NPS above sector benchmark |
| Price premium | “Would you pay more for [brand] than a comparable product?” | % willing to pay premium |
Pro Tip: Map each survey question to a commercial KPI before fieldwork. Awareness questions should connect to top-of-funnel traffic data; preference questions to conversion rates. Consumer metrics mapped to commercial KPIs dramatically improve the usefulness of brand tracking.
Treat brand equity measurement as a trend line, not a snapshot. Frequent cadence and continuous tracking reveal directional momentum before it becomes a structural problem. A single quarterly score tells you where you are; twelve months of monthly data tells you where you are going.
There is no universal timeline, but the pattern is consistent across sectors. Foundational awareness — getting into the consideration set of your target audience — typically takes a couple of years of sustained, consistent activity for a new or repositioning brand. Moving from awareness to genuine preference takes longer: most practitioners see meaningful shifts in association strength and perceived quality after several years of coherent brand investment.
Reaching the level of equity that produces a measurable price premium or significant brand valuation is a multi-year endeavour for most businesses. Apple, Nike, and John Lewis did not build their equity in a single campaign cycle. What accelerates the process is consistency — of message, experience, and quality — rather than spend alone. A brand that spends heavily but inconsistently will build slower than one that spends moderately but never contradicts itself.
The practical implication for UK businesses: set a 3-year horizon for your first meaningful equity milestone (preference above the category average), and build measurement infrastructure from day one so you can prove progress to stakeholders before the financial outcomes are visible.
Brand equity is a consumer-held asset that converts perceptions into commercial outcomes — and it requires consistent investment, rigorous measurement, and protected IP to sustain.
| Point | Details |
|---|---|
| Definition | Brand equity is the extra commercial value a brand name adds, built from consumer perceptions, associations, and feelings. |
| Four core components | Brand awareness, brand associations, perceived quality, and brand loyalty are the main measurement levers. |
| Measurement cadence | Use a balanced scorecard of 8–12 metrics; review monthly and quarterly to catch directional shifts early. |
| Building timeline | Expect 12–24 months to establish awareness, 2–3 years for preference, and 5–10 years for measurable price premium. |
| Viaductgen’s role | Viaductgen connects brand strategy, measurement, and revenue attribution into a single growth system for mid-market businesses. |
Most businesses treat brand measurement as a once-a-year exercise. The result is a number that tells you where you were, not where you are heading. Viaductgen takes a different approach: brand strategy, identity, and measurement are built as components of a connected growth system, where every data point feeds the next decision.
Through Viaductgen’s brand strategy and identity design service, mid-market and scale-up businesses get senior-led positioning work tied directly to commercial KPIs — not a rebrand that sits in a brand guidelines PDF. AI-powered tracking connects awareness and preference data to pipeline and revenue, so you can show the board what brand investment is actually returning. The five-phase Growth Engine means brand activity does not run in isolation from search, performance, or conversion work.
If you are ready to move from brand activity to brand intelligence, see how Viaductgen works.
Brand equity is the extra value a brand name adds to a product or service, based on what consumers think, feel, and believe about it. A product with strong brand equity commands higher prices and greater loyalty than an identical unbranded product.
Brand equity is the consumer perception that drives commercial outcomes; brand value is the financial expression of that equity, calculated in monetary terms by firms such as Brand Finance or Kantar BrandZ. Equity is the cause; value is the effect.
The four core components, drawn from Aaker’s model, are brand awareness, brand associations, perceived quality, and brand loyalty. Proprietary assets such as trademarks are a fifth structural component.
Use a dual-stream approach: consumer metrics (awareness, preference, NPS, perceived quality) collected via survey panels such as YouGov or Kantar, combined with financial metrics (price premium, brand revenue contribution). Restrict your scorecard to 8–12 metrics and review at least quarterly.
Foundational awareness typically takes 12–24 months; meaningful preference shifts take 2–3 years; a measurable price premium usually requires 5–10 years of consistent brand investment.

