
Pipeline marketing is the practice of running marketing activity against revenue outcomes, measured in qualified pipeline value rather than lead volume. The single metric that matters first is marketing sourced and influenced pipeline, tracked at the account and opportunity level. It replaces marketing qualified leads (MQLs) as the scoreboard because MQLs count interest, not intent to buy, and interest has never once closed a deal on its own.
Getting this right depends on a small set of moving parts working together. Miss one and the whole model wobbles.
Ideal customer profile (ICP): a tight, agreed definition of who you are actually trying to sell to
Account-level data: deanonymised visits, intent signals and buying-committee mapping, not just individual contact records
Attribution: multi-touch, deal-level tracking that credits the campaigns that actually moved a deal forward
ABM plays: account-based marketing tactics aimed at named accounts rather than anonymous form-fills
Pipeline marketing succeeds when marketing and sales share one definition of qualified pipeline, one dashboard, and one accountability structure for revenue.
| Point | Details |
|---|---|
| Measure pipeline, not leads | Track marketing-sourced and influenced pipeline value as the primary scoreboard, not MQL volume. |
| Fix the leaky bucket | Keep marketing engaged past the handoff to stop deals stalling silently mid-funnel. |
| Define stages with criteria | Use clear criteria for each pipeline stage so marketing plays match where an account actually is. |
| Set attribution windows correctly | Match attribution windows to the median sales cycle plus roughly 15% to avoid under-crediting early campaigns. |
| Get expert support to move fast | Viaductgen’s 90-day sprint model builds ICP refresh, SLAs and attribution dashboards with senior-led execution. |
Which attribution model actually shows pipeline contribution?
How Viaductgen builds pipeline marketing that survives contact with sales
The definitive framing from Adobe is blunt about this: pipeline marketing reframes success around pipeline created, pipeline influenced, and revenue won, not around how many forms got filled in last month. That means marketing stops owning a stage (top-of-funnel awareness) and starts co-owning an outcome (closed revenue).
Lead generation asks “how many people raised their hand?” Pipeline marketing asks “how much qualified opportunity value did we create, and did it turn into money?” That’s not a semantic difference. It changes which channels get budget, how campaigns get judged, and who sits in the weekly pipeline review.
| Dimension | Lead generation | Pipeline marketing |
|---|---|---|
| Primary focus | Volume of contacts captured | Value and quality of opportunities created |
| Core metric | MQLs, cost per lead | Pipeline sourced, pipeline influenced, win rate |
| Ownership | Marketing alone, handed to sales | Shared between marketing and sales |
| Channel optimisation | Cheapest cost per lead wins | Cheapest cost per opportunity wins |
Picture two SaaS companies running the same £50,000 monthly ad budget. Company A optimises for cost per lead and generates 2,000 leads at £25 each. Sales works through them and closes three deals, because most were tyre kickers who downloaded a whitepaper for a free PDF. Company B optimises for cost per opportunity, spends the same £50,000 on account-based targeting against a defined ICP list of 400 companies, generates 120 leads, and closes eleven deals. Same spend, wildly different outcome, because pipeline marketing was built to reward the second behaviour, not the first.
Here’s the failure mode nearly every B2B company falls into at some point: marketing generates a lead, hands it to sales, and considers the job done. Sales works it for a few weeks, it stalls in a middle stage, and nobody circles back. The leaky-bucket problem is exactly this. Contacts drop out at every handoff because no one owns the account through the full buying cycle.
Think about two companies chasing the same market. Company One is volume-driven: marketing’s job ends at MQL, sales owns everything after, and pipeline reviews focus on activity counts, calls made, emails sent. Company Two is pipeline-driven: marketing stays engaged through late-stage nurture, sends account-specific content when a deal stalls, and joins the weekly pipeline review. Over a year, Company Two typically sees far fewer deals go cold in the middle stages, because someone is actually watching for the leak and patching it in real time.
Misaligned metrics carry a real commercial cost, and it shows up in places leaders don’t always look first.
Sales blames marketing for “bad leads” while marketing blames sales for “not following up”
Budget gets allocated to the channel with the cheapest cost per lead, even when that channel produces the worst win rate
Deals stall silently in the middle of the funnel because no one is accountable for moving them
Forecasting becomes guesswork because marketing’s numbers and sales’s numbers never reconcile
Shared pipeline accountability fixes this by putting both teams against the same number, in the same dashboard, reviewed in the same meeting.
Pro Tip: If marketing and sales can’t agree on how many opportunities came from a given campaign, that’s not a reporting glitch. It’s a sign the two teams are running from different definitions of what counts as a qualified account, and that gap will cost you every quarter until you close it.
A workable stage model has six steps, and each one needs its own criteria and its own marketing plays. Vague stage definitions are where most pipeline reporting quietly falls apart.
| Stage | Criteria | Marketing activity |
|---|---|---|
| Prospect | Fits ICP, no engagement yet | ABM targeting, cold outbound support, paid social awareness |
| Engaged account | Multiple visits, content downloads, or ad engagement | Intent-triggered email plays, retargeting, gated case studies |
| Marketing qualified account (MQA) | Buying committee showing activity, fit score high | Executive content, webinar invites, personalised landing pages |
| Opportunity | Sales has confirmed budget, need and timeline | Late-stage accelerators: ROI calculators, competitive battlecards, customer proof |
| Closed won | Contract signed | Onboarding content, expansion signals monitoring |
| Expansion | Existing customer showing new buying signals | Upsell campaigns, executive roundtables, renewal nurture |
Marketing’s job doesn’t stop at MQA. This is where the flywheel model HubSpot popularised matters: engagement continues well past the first conversion, and expansion revenue from existing accounts is often cheaper to generate than net-new pipeline.
Set conversion targets stage by stage rather than funnel-wide. A useful checklist marketing can run before calling an account “sales ready”: has the buying committee been mapped, has budget authority been confirmed at even a preliminary level, and has the account engaged with at least two distinct content assets in the past 30 days? If any of those three are missing, the account probably isn’t an MQA yet, whatever the lead score says.
Governance is the unglamorous part of pipeline marketing, and it’s also the part that determines whether any of the rest of this works. Without a shared service-level agreement (SLA), marketing and sales will keep operating on different definitions of “qualified,” and every pipeline number will be disputed before it reaches a board deck.
Four elements need to be agreed before anything else:
A single, written ICP definition that both teams sign off on, reviewed quarterly
A shared definition of what counts as an opportunity, not just a lead
Clear MQA criteria, agreed jointly rather than set by marketing alone
Response-time SLAs: how fast sales must follow up on an MQA, and how fast marketing must supply requested collateral
A practical SLA template looks like this: sales contacts every MQA within one business day, logs a disposition (accepted, rejected, recycled) within three days, and marketing receives a reason code on every rejected account so campaigns can be adjusted. Weekly pipeline reviews should include both teams, not a marketing-only readout, followed by a separate sales forecast call.
Watch for red flags. If more than a third of MQAs are getting rejected without a reason code, your qualification criteria are broken, not your lead quality. If sales stops attending the joint pipeline review, alignment has already failed, and the fix starts with a direct conversation between the CMO and the sales leader, not another dashboard.
First-touch attribution credits whichever channel brought the account in the door. Last-touch credits whatever happened right before the deal closed. Both are simple, and both lie to you in a B2B context where a typical deal touches eight or more channels before it closes, a complexity Gartner has documented extensively in its research on modern B2B buying journeys.
Multi-touch, deal-level attribution is the only model that gives an honest picture, because it distributes credit across every touchpoint that contributed to moving a deal, not just the first or last one.
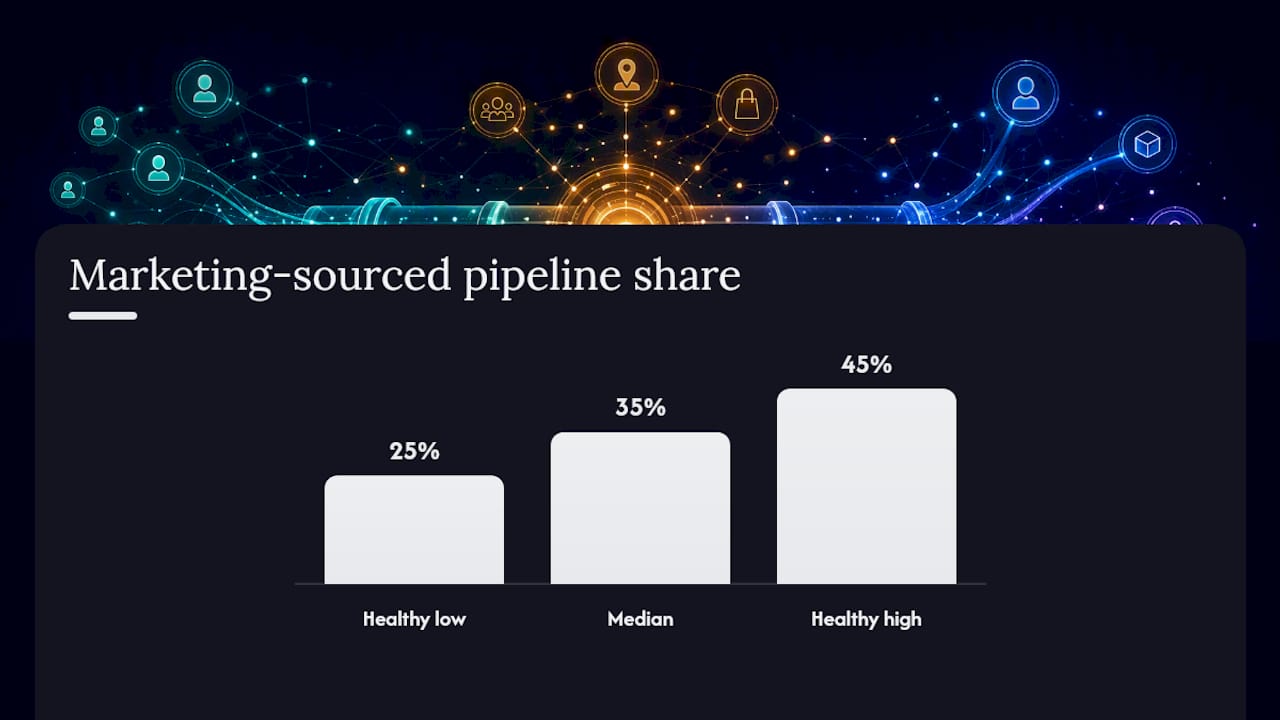
A benchmark worth anchoring to: healthy marketing-sourced pipeline share for mid-market B2B SaaS companies sits between 25% and 45%, with a median around 35%. Marketing-influenced pipeline, a broader measure that includes touches on deals sales originated, generally falls within a wide mid-to-high range, with averages reflecting significant influence.
| KPI | What it measures | Why it matters |
|---|---|---|
| Pipeline sourced | Deals marketing originated | Shows direct revenue creation |
| Pipeline influenced | Deals marketing touched at any stage | Shows broader contribution |
| Cost per opportunity | Spend divided by qualified opportunities | Replaces cost per lead as the real efficiency metric |
| Pipeline velocity | Speed deals move through stages | Flags where deals are getting stuck |
| Win rate | Opportunities won divided by opportunities created | Tests whether pipeline quality is improving |
Set your attribution window to the median sales cycle plus roughly 15%, a rule of thumb backed by Strivelabs’ guidance on avoiding under-crediting early-funnel campaigns whose impact only shows up months later. Before reporting any of this, run a data hygiene pass: deduplicate contact records, confirm UTM conventions are applied consistently, and check that every closed-won opportunity has a first-touch source recorded. Reports built on messy CRM data will undermine trust in the whole model faster than any attribution debate. Viaductgen’s own approach to revenue attribution leans on exactly this kind of deal-level tracking to keep marketing and sales reading the same numbers.
Not every channel deserves equal budget once you start measuring cost per opportunity instead of cost per lead. Some channels look cheap on a cost-per-lead basis and turn out expensive once you divide spend by actual qualified opportunities produced.
Prioritise channels this way, roughly in order of pipeline efficiency for most mid-market B2B companies:
Account-based marketing (ABM): targets named accounts directly, typically the highest opportunity-to-spend ratio for complex, multi-stakeholder deals
Intent-driven outreach: triggered by third-party intent data showing an account is actively researching a category
Paid search on high-intent queries: captures buyers already searching for a solution category, not top-of-funnel awareness terms
LinkedIn account outreach: effective for reaching specific buying-committee members at target accounts
Content built for the buying committee: case studies, ROI tools and comparison guides that support multiple stakeholders, not just one persona
Executive events and roundtables: slower to scale but strong for late-stage acceleration on larger deals
Early-stage plays should focus on account awareness (ABM display, LinkedIn thought leadership). Mid-stage plays need to nudge engaged accounts toward MQA status, retargeting, nurture sequences built around specific content built for full-funnel marketing, and personalised outreach. Late-stage plays should remove friction: ROI calculators, competitive comparisons, customer references on demand.
To calculate cost per opportunity per channel, divide total channel spend by the number of opportunities that channel touched at any stage, not just the ones it originated. That single change in the formula usually reshuffles the entire channel ranking.
Moving from lead-centric to pipeline-centric operations doesn’t need a year-long transformation programme. It needs a focused 90 days and clear ownership at each step.
Refresh the ICP with sales input, not marketing assumptions alone
Baseline current attribution: what does pipeline sourced versus influenced look like today?
Launch one pilot ABM campaign against a defined account list
Draft and sign off the SLA between marketing and sales
Build a shared pipeline dashboard both teams check weekly
Run a full data hygiene pass on CRM and marketing automation records
Assign clear roles: who owns dashboards, who owns SLA enforcement, who owns campaign iteration
Establish a weekly pipeline review cadence with both teams present
| Window | Focus |
|---|---|
| Days 1-30 | ICP refresh, attribution baseline, data hygiene |
| — | SLA agreement, dashboard build, pilot campaign launch |
| — | Review pilot results, adjust channel mix, formalise review rhythm |
Marketing operations should own the dashboard build. RevOps owns data hygiene and CRM integrity. Demand generation owns the pilot campaign. Sales leadership owns SLA enforcement on their side of the handoff. For smaller deals with short sales cycles, this full stack can be more than you need. Simple CRM hygiene and a weekly pipeline review often deliver comparable value without the added infrastructure.
Most pipeline marketing rollouts stumble on the same handful of technical issues before they stumble on strategy.
Inconsistent UTM conventions mean campaigns can’t be reliably grouped in reporting
Missing GCLID or click IDs break paid search attribution at the exact moment you need it most
Attribution windows set to platform defaults (often 7 or 30 days) badly under-credit long B2B sales cycles
No account deanonymisation means you’re measuring individual contacts while sales is thinking in accounts
Quick fixes marketing and RevOps can apply within a week: standardise UTM naming conventions across every live campaign, audit the last quarter’s closed-won deals for missing source data, and extend attribution windows to match the median sales cycle. If the data is mostly clean but conversion rates are underwhelming, keep iterating in-market rather than stopping to rebuild infrastructure that isn’t actually broken.
Pro Tip: Before you blame a channel for poor performance, check whether its attribution window even covers your typical sales cycle. Half the “underperforming channel” conversations in pipeline reviews are actually measurement problems wearing a performance costume.
A mid-market B2B software client came to Viaductgen with a familiar complaint: marketing was hitting its MQL targets every quarter, but sales leadership couldn’t see where any of it turned into revenue. The two teams were reporting from separate spreadsheets with different definitions of “qualified.”
Viaductgen ran its five-phase Growth Engine against the problem. AI-powered intelligence surfaced which accounts and channels were actually converting to opportunities, not just leads. The strategic blueprint phase rebuilt the ICP and stage definitions jointly with the client’s sales leadership. AI-amplified execution launched targeted ABM campaigns against the refined account list, while human-led optimisation adjusted messaging and channel mix weekly based on live pipeline data rather than lead-volume reports.
The result the client cared about wasn’t more leads. It was a dashboard both teams trusted, and a pipeline number sales stopped arguing with.
Within the first sprint cycle, the client reported meaningful improvement in pipeline velocity and a tighter link between marketing spend and closed revenue. Full anonymised case studies detailing these engagements, prepared under the direction of Viaductgen’s senior strategist Fabio, are available on request.
Building the ICP refresh, the SLA, the dashboard and the attribution model is straightforward on paper. Getting all four running correctly, at once, inside a 90-day window, while sales leadership stays sceptical of yet another marketing initiative, is where most in-house teams run out of time. Viaductgen’s 90-day sprint model exists precisely for that gap: senior strategists work alongside your team to run the ICP refresh, build the shared dashboard, and set up deal-level attribution, rather than handing you a slide deck and wishing you luck.
The AI-native infrastructure behind how Viaductgen works with clients means account-level intent data and attribution modelling get built faster than a traditional agency retainer typically allows, without cutting the senior strategic input that makes an SLA between marketing and sales actually hold. Pattern recognition drawn from more than 50 client engagements means the ICP refresh and stage criteria aren’t starting from a blank page.
If your marketing and sales teams are reading different pipeline numbers this quarter, that’s the problem worth solving before the next one starts. Get in touch with Viaductgen to talk through what a 90-day pipeline marketing sprint would look like for your revenue model.
The Definitive Guide to Pipeline Marketing: account-level attribution and dashboard requirements
Pipeline Marketing: A Complete B2B Framework: governance and stage definitions
Gartner on B2B buying journeys: buying-committee complexity data
Pipeline in marketing refers to the total value of qualified opportunities that marketing has sourced or influenced as they move toward closed revenue, tracked at the account and deal level rather than the individual lead level.
Common models use prospect, engaged account, marketing qualified account, opportunity and closed won, though many teams add an expansion stage to capture upsell and renewal activity after the sale.
Definitions of this rule vary across sources, so treat any single version cautiously. A widely cited version attributes 40% of campaign success to audience targeting, 40% to the offer, and 20% to creative execution.
No. A CRM is the system that stores account, contact and deal records, while pipeline is the metric and operating model built on top of that data, measuring qualified opportunity value as it moves toward revenue.
Lead generation measures volume of contacts captured, while pipeline marketing measures the value and quality of opportunities created, with marketing and sales sharing ownership of the outcome rather than marketing handing off at the MQL stage.

