
A North Star metric is the single measure that captures the core value your product delivers to customers, and marketing’s job is to align campaigns, channels, and lifecycle activity around the inputs that move it. Treat it as a leading indicator of revenue, not a substitute for revenue itself. Get the definition right and the rest of your growth strategy organises itself around one honest question: are we creating more value for customers this month than last?
TL;DR:
- A good North Star metric must directly reflect actual customer benefit, not just activity or sign-ups, and should predict revenue or retention weeks or months in advance.
- It must be influenceable by teams, explainable in one sentence, and consistently measurable to serve as a reliable growth guide.
- Decomposing the NSM into input metrics across areas like activation and retention helps marketing influence the overall value delivery, with guardrails like satisfaction scores ensuring quality.
- The choice of NSM varies by business model, aligning with specific value moments such as successful transactions for marketplaces or engaged viewing time for media platforms.
- Effective implementation requires a single, automated dashboard, clear ownership of input metrics, and regular reviews to keep the focus on upstream activities that lead to sustainable growth.
A North Star metric (NSM) is the single number that best represents the value your product delivers to customers, distinct from both a KPI (a channel-level or team-level measure) and revenue (a lagging financial outcome). Mixpanel’s framing is useful here: the NSM should act as a leading indicator of revenue and retention, not a restatement of either. Marketers often default to tracking revenue or raw traffic because those numbers are easy to report upward. Neither tells you whether customers are getting value, which is the thing that actually sustains growth.
Not every candidate metric deserves the title. Basedash’s practical checklist sets out five tests worth applying rigorously before you commit a team to a number:
A short example makes each test concrete. “Weekly active users” fails the customer value test because logging in proves nothing about benefit received. “Nights booked” for a travel marketplace passes it, because a booked night is the moment the customer actually receives what they came for. “Total sign ups” fails the leading test because sign ups rarely predict revenue on their own, while “activated accounts that completed a first core action” usually does. Run every candidate through these five filters before it reaches a dashboard, and you will retire most of the vanity metrics your team has been reporting for years.
Marketing teams often run three good campaigns that pull in opposite directions: one optimised for lead volume, another for brand reach, a third for conversion rate. An NSM fixes that by giving every channel, campaign, and product input a shared target to move.
The practical benefits break down into three areas:
Consider how this plays out through the funnel. Acquisition campaigns feed the top of the metric tree by driving qualified sign ups. Onboarding activity, whether that is a welcome email sequence or an in-product tutorial, determines how many of those sign ups reach the value moment the NSM actually measures. Lifecycle marketing, from re-engagement flows to renewal nudges, protects and compounds that value once it exists. Each of those functions has always run its own KPIs; the NSM is what tells you whether they are collectively working.
Pro Tip: Before your next campaign planning cycle, ask every channel owner one question: “How does this activity move the North Star input you’re responsible for?” If nobody can answer in a sentence, the campaign is optimising for the wrong thing.
Choosing an NSM is a discovery exercise, not a brainstorming session. Amplitude’s playbook recommends starting with the value moment in words before you ever touch a number, and the process below builds on that instinct.
A few checks are worth running before you present a final choice to leadership:
The temptation is to skip straight to step two. Resist it. Teams that write the value statement first tend to land on metrics that survive contact with real data; teams that start with a spreadsheet of candidate numbers tend to pick whatever is easiest to pull from existing dashboards.
An NSM without a metric tree underneath it is just a number nobody can move. Decomposition breaks the top-line metric into inputs across four dimensions: breadth (how many customers reach the value moment), depth (how much value each one gets), frequency (how often they return to get it), and efficiency (the cost or effort required to deliver it). Marketing rarely owns all four, but it owns more of them than most teams assume.
Typical marketing-influenced inputs include:
Each of those inputs is a lever a campaign, lifecycle email, or landing page redesign can genuinely move, which is exactly why decomposition matters more to marketers than the top-line number itself.
Guardrails exist to stop a rising NSM from masking damage elsewhere. Churn, satisfaction scores such as NPS or CSAT, and LTV to CAC ratio are the standard set. Mixpanel’s guidance is explicit that guardrails should include retention and satisfaction measures precisely so growth is never bought at the expense of the customer experience that made the NSM worth tracking in the first place.
Precision matters more than most teams expect. A metric like “weekly active teams” is trivially gameable; “weekly active teams that completed a core report” is not. Adding a frequency, quality, or unit-of-value qualifier to every input metric is usually the single most effective defence against a metric that looks healthy while the business quietly weakens underneath it.
Revenue itself belongs on the guardrail list, not on the North Star. Kissmetrics makes the case plainly: revenue is a lagging outcome, and treating it as a guardrail rather than the target keeps teams focused on the upstream behaviour that actually produces it.
The right NSM always maps to a specific value moment, which means it varies sharply by business model. Amplitude’s “games” framework, which sorts products into attention, transaction, and productivity categories, is a useful lens for narrowing candidates before you run them through the five-test checklist.
| Business model | Value moment | Candidate North Star metric | Tailoring notes |
|---|---|---|---|
| Marketplace | A transaction completes successfully between two sides | Completed transactions per active user | Qualify by “successful” (not attempted) to avoid rewarding abandoned checkouts |
| SaaS | A customer accomplishes a core task inside the product | Weekly active accounts completing a core workflow | Add a frequency threshold, since login alone is not value |
| E-commerce | A customer receives a product they are satisfied with | Repeat purchase rate within a defined window | Pair with a return-rate guardrail to catch low-quality volume |
| Media / content | A customer consumes content that satisfies their intent | Minutes of engaged content consumption per active user | Distinguish “engaged” viewing from autoplay to prevent gaming |
| Messaging | Two or more people exchange a meaningful message | Number of conversations with a reply | Reward reciprocal exchange, not one-sided message volume |
ProductOS’s examples guide reinforces the pattern across dozens of companies: nearly every durable NSM counts a “value moment” (a night booked, an hour watched, a transaction completed) rather than a raw user count or a revenue figure.
Businesses running multiple lines, a marketplace with a separate advertising product, for instance, usually need segmented NSMs per line rather than forcing one number to represent two different value moments. Trying to average them together tends to obscure both.
A North Star metric only earns its name once it is measured the same way every time and reviewed on a schedule someone actually keeps. The first requirement is a single source of truth: one authoritative definition of the events that feed the metric, agreed between marketing, product, and data teams, sitting in a near-real-time dashboard rather than a monthly spreadsheet export.
Ownership needs to be explicit at the input level, not just at the top:
Reporting on channel-level performance without connecting it back to the North Star is one of the most common reasons marketing dashboards get ignored by leadership; Viaductgen’s guidance on SEO reporting covers how to build that revenue-connected view at the channel level specifically.
Pro Tip: Put the North Star and its four or five inputs on one screen, updated automatically, and nothing else. A dashboard with forty metrics gets checked once a quarter. A dashboard with five gets checked every Monday.
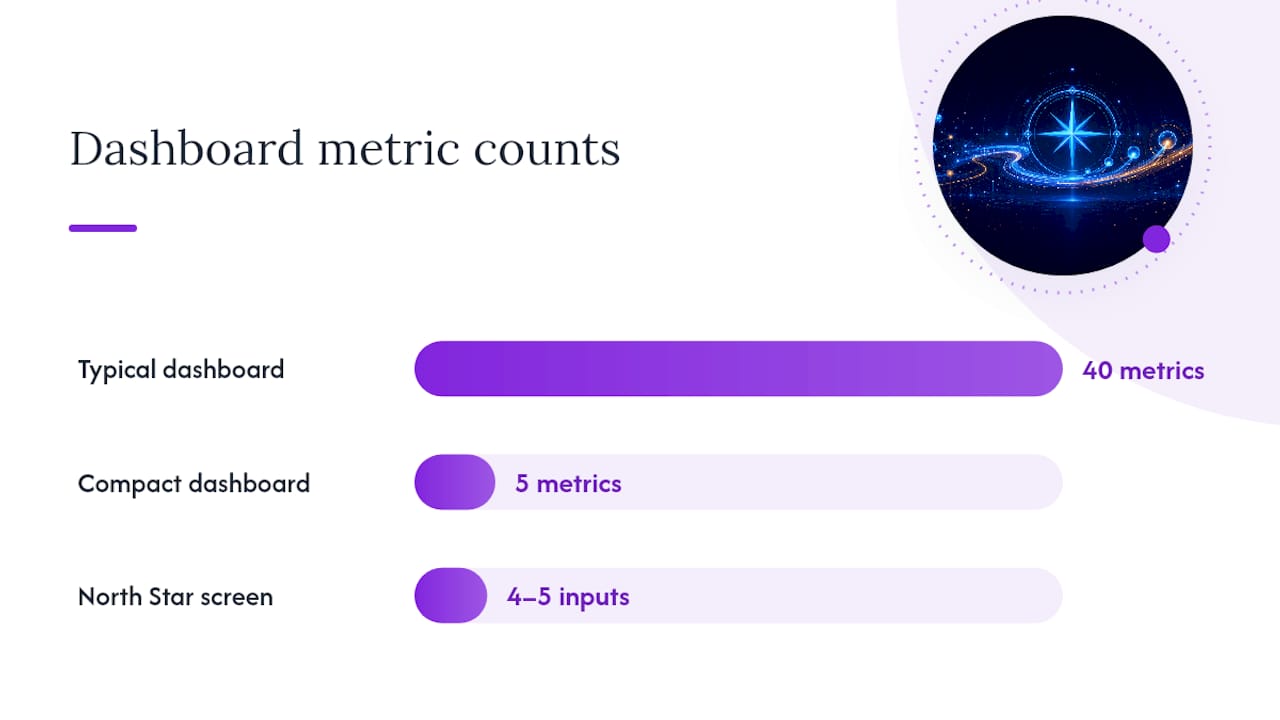
Most North Star failures are self-inflicted, and they follow recognisable patterns.
I have watched marketing teams chase a dozen KPIs at once and still lose the argument about what growth actually means. At Viaductgen, our Growth Engine treats the North Star as the anchor for every input we touch, search, paid, brand, and conversion optimisation, because a campaign that cannot be traced to a value moment is a campaign we cannot defend.
A 90-day sprint built around an NSM typically runs through eight stages:
An anonymised engagement following this structure moved activation rate and week-4 retention as the primary inputs, with churn and CAC:LTV tracked as guardrails throughout, giving leadership a revenue-connected read on marketing performance inside a single quarter.
Choosing the right metric is a day’s work. Building the dashboards, ownership structure, and experimentation cadence that keep it honest for the next two years is where most teams stall, and it is exactly where Viaductgen’s AI-native Growth Engine earns its keep. Our senior strategists run discovery and instrumentation inside a 90-day sprint, using proprietary AI infrastructure to model input correlations faster than a traditional agency team could manually, while keeping a named senior lead accountable for the outcome rather than a junior account handler. If you already know your value moment but need the metric tree and guardrails built properly, explore how we use AI in client work to see how discovery translates into an operational dashboard within the first sprint. The natural next step is a discovery workshop scoped against your own North Star candidate, not a generic audit.

For a deeper walkthrough of the five-test method and inversion testing, Basedash’s framework guide is the most actionable single resource available. Amplitude’s product playbook offers the clearest breakdown of the attention, transaction, and productivity model for narrowing candidates by business type. For templates and additional worked examples across industries, LiveSession’s guide to North Star frameworks is a solid practical companion once you are ready to build your own metric tree.
It is the single metric marketing teams align campaigns and lifecycle activity around, chosen because it reflects the value moment customers actually experience and leads revenue rather than simply reporting it.
A North Star metric is one company-wide measure of delivered customer value, while KPIs are channel or team-level measures (like CTR or CPL) that track whether specific activities are moving that North Star.
Common examples include nights booked for a marketplace, weekly active accounts completing a core workflow for SaaS, and minutes of engaged content consumption for media platforms, each chosen to represent a real value moment rather than raw activity.
Netflix is widely cited as tracking hours streamed or engaged viewing time, a metric that reflects genuine content value delivered rather than sign ups or raw logins, though exact internal definitions are not publicly disclosed in detail.
Review it at least annually, and immediately whenever the product, market, or business model changes materially enough that the original value moment no longer holds.

