
A marketing data warehouse is a centralised, queryable store that pulls campaign, CRM, email and web analytics data into one place so you can measure attribution, retention and spend efficiency without stitching spreadsheets together every Monday morning. If your team can’t answer “which channel actually drove that customer” without a two-day export exercise, this is the fix.
Here’s a quick way to check whether you need one right now:
Use one when you’re joining three or more paid marketing sources, multiple teams need read access to the same numbers, or you need to retain data beyond what your ad platforms allow.
Skip it for now when you run one or two channels, one person owns reporting, and spreadsheets still answer your questions inside a day.
Next step: audit how many source systems currently feed your monthly report. If it’s more than three, start scoping a warehouse this quarter.
Analyst firms including Gartner have tracked the shift toward centralised marketing data infrastructure for years, and the underlying technology, cloud warehouses like Databricks, has matured enough that this is no longer an enterprise-only project. Viaduct Generation builds these systems for mid-market teams who want the outcome without hiring a data engineering department.
A marketing data warehouse succeeds when governance and dimensional modelling come before technology selection, and it requires clear metric definitions, the right connector strategy, and a serving layer matched to your activation needs.
| Point | Details |
|---|---|
| Define metrics first | Agree on canonical definitions for leads, customers and conversions before building connectors. |
| Modelling beats platform choice | A well-modelled warehouse on a mid-tier platform outperforms a poorly modelled one on a premium platform. |
| Warehouses don’t activate natively | Pair with a CDP or reverse ETL tool if you need live segment pushes to ad platforms. |
| Choose your path deliberately | Cloud DIY, managed enterprise, or marketing-native managed each suit different budgets and team skills. |
| Governance runs in parallel | Build access controls, lineage and schema-change monitoring alongside implementation, not after. |
How the architecture actually flows from source to dashboard
Governance and data quality: the part vendors don’t sell you
The commercial case is simple: you stop guessing which channels deserve budget. Once campaign, CRM and web data sit in one modelled store, you can build multi-touch attribution that doesn’t collapse the customer journey into “last click won.” Viaduct Generation’s own approach to attribution is built on exactly this premise, joining ad spend to actual revenue outcomes rather than platform-reported conversions.
Three outcomes tend to justify the build on their own:
Cross-channel attribution. You can finally see that paid social assists conversions it never gets credit for in platform dashboards, because multi-touch attribution models need every touchpoint in one table to work properly.
Unified CAC and LTV. Blending CRM revenue data with ad spend lets you calculate customer acquisition cost and lifetime value per channel, not just per campaign, which changes budget allocation conversations entirely.
Cohort and retention analysis. Grouping customers by acquisition month or channel and tracking their behaviour over 12, 18 or 24 months reveals which channels bring loyal customers versus one-time buyers, something no single platform’s dashboard shows you.
Fragmented reporting has a real cost. Marketers still lean on spreadsheets as an interim layer, but that approach breaks down once you’re joining multiple paid sources with CRM and web data. The manual reconciliation isn’t just slow, it introduces version drift between teams looking at “the same” number.
The pattern shows up constantly in B2B growth work: demand generation and sales development teams pull different numbers for the same campaign because nobody agreed on a shared definition of “qualified lead” before building the reports. A unified data model fixes that at the source rather than in a follow-up meeting.
A warehouse is not a magic fix, and treating it as one is the most expensive mistake teams make. It solves storage and structure, not everything downstream of that.
Three limitations matter most:
It doesn’t natively activate segments. A warehouse is built for historical analysis and reporting, not for pushing a live audience into an ad platform in real time. You need reverse ETL or a customer data platform (CDP) layered on top for that.
It doesn’t clean bad data on its own. Centralising three inconsistent CRM fields into one table just gives you one inconsistent table, faster. A warehouse without governance simply accelerates analysis of poor-quality data.
It doesn’t do identity resolution automatically. Matching an anonymous website visitor to a known CRM contact requires deliberate modelling work, not something that happens because the data now lives in the same place.
Pro Tip: Start your governance plan before you write a single transformation query. Deciding what “a customer” and “a qualified lead” mean, and getting stakeholders to agree, saves months of rework later.
Picture the data moving through five stages: source connectors pull data out of ad platforms, your CRM and web analytics; a raw landing zone stores it unmodified; a transformation and modelling layer reshapes it into clean tables; curated marts organise those tables by business use case; and a serving layer, whether that’s a BI tool or a reverse ETL connection, puts it in front of humans or downstream systems.
Each layer has a distinct job:
Connectors extract data from source systems on a schedule, usually every 15 minutes to once a day, since near-instant replication is expensive and rarely needed for retrospective marketing analysis.
Raw landing zone stores an unaltered copy of everything ingested, so you can always rebuild downstream tables if a transformation breaks.
Transformation and modelling layer joins, cleans and restructures raw data into dimensional models, typically star schemas with a shared customer key.
Curated marts are purpose-built tables for specific teams, such as a “campaign performance” mart or a “customer lifetime value” mart.
Serving and activation exposes the modelled data through BI tools for reporting or pushes segments back out through reverse ETL for activation.
The modelling layer critically determines project success more than the choice of database platform. Dimensional modelling and identity resolution are what turn a pile of raw tables into something a marketer can actually query without a data engineer translating every request. Skip this step and you’ve just built an expensive filing cabinet.
Success here depends far more on getting the modelled layer right than on which underlying database you pick. A well-modelled warehouse on a mid-tier platform will outperform a poorly modelled one on the most expensive enterprise product every time, because the join logic and metric definitions live in that middle layer, not in the storage engine.
Vendors fall into four functional groups, and understanding the group matters more than memorising every product name.
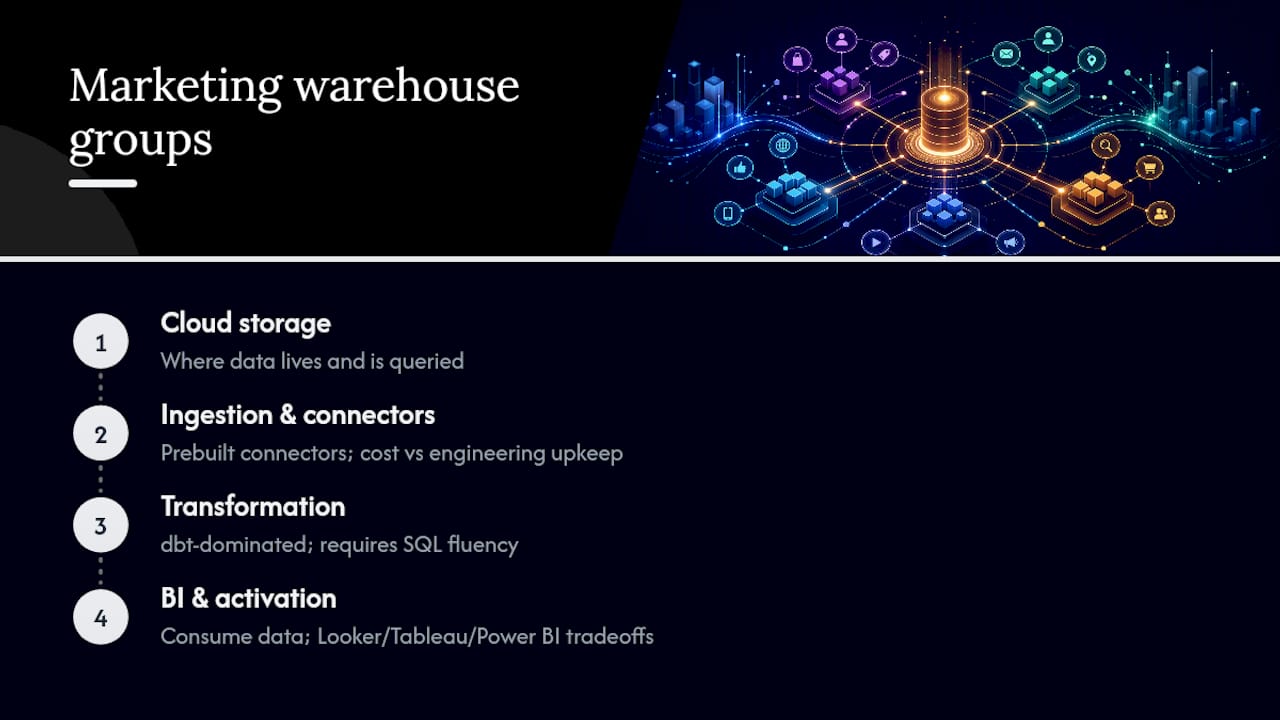
Cloud storage and compute is where your data physically lives and gets queried. Google BigQuery charges primarily for query volume and suits teams comfortable with usage-based billing; Snowflake separates storage and compute cleanly but can get costly at scale without careful monitoring; Microsoft Azure Synapse Analytics bundles storage, analytics and orchestration well for teams already inside the Microsoft ecosystem; Amazon Redshift fits teams already running heavily on AWS but requires more manual tuning than newer platforms; Databricks adds strong governance tooling through Unity Catalog and suits teams blending marketing analytics with broader data science work.
Ingestion and connectors move data from source systems into the warehouse. Fivetran offers the broadest pre-built connector library but charges per row synced, which adds up fast at scale; Airbyte is open source and cheaper to run but needs more engineering upkeep; Stitch is simpler and budget-friendly for smaller connector counts but has a thinner feature set than its rivals; Supermetrics and Funnel both specialise specifically in marketing platform connectors, making them faster to set up for ad and analytics data than general-purpose ETL tools.
Transformation and modelling is dominated by dbt, which has become close to a default for writing and version-controlling SQL transformations, though it demands SQL fluency your team may need to build.
BI and activation covers how humans and systems consume the data. Looker integrates tightly with BigQuery and supports a semantic layer well, but licensing costs can surprise smaller teams; Tableau has the strongest visualisation flexibility but a steeper learning curve for non-analysts; Power BI is the cheapest entry point for teams already on Microsoft 365 and handles most standard reporting needs comfortably.
Match the platform to your team’s actual constraints, not to whichever vendor has the loudest marketing. Run through this checklist before you commit:
Cost model: does usage-based pricing (BigQuery-style) or predictable storage-plus-compute pricing (Snowflake-style) fit your budget certainty needs better?
Scale and concurrency: how many analysts will query simultaneously, and how large will your historical dataset grow?
Integration surface: does the platform connect natively to your existing ad platforms, CRM and email tools, or will you need custom connectors?
dbt compatibility: can your chosen transformation tool run cleanly against the warehouse you’re evaluating?
Security and governance: does it support role-based access control and meet GDPR requirements for storing customer data?
When you’re actually in procurement conversations, ask vendors these ten questions:
What’s your pricing model, and can you show a realistic monthly estimate for our data volume?
How do you handle schema changes in source systems without breaking downstream tables?
What’s your uptime guarantee and typical query latency at our expected concurrency?
Do you support row-level or column-level access controls?
How do you handle GDPR data subject requests, including deletion?
What connectors do you offer natively, and which need third-party tools?
How well does your platform work with dbt for transformations?
What’s your data retention policy and archival pricing?
Can we run a proof-of-concept before signing an annual contract?
What support is included, and what costs extra?
On cost: BigQuery, Snowflake and Postgres sit at genuinely different price points for mid-market workloads, and usage-based models can feel cheaper at first before scaling unpredictably. Ask for a worst-case monthly estimate, not just a best-case one.
Whichever platform you land on, the implementation sequence looks broadly similar:
Discovery and governance kickoff. Agree on canonical metric definitions (what counts as a lead, a customer, a conversion) before any technical work starts.
Connect your sources. Set up connectors for your priority ad platforms, CRM and web analytics, landing raw data unmodified.
Build the transformation layer. Write the modelling logic that joins sources on a shared customer key and produces clean fact and dimension tables.
Design curated marts. Build purpose-specific tables for attribution, cohort analysis and spend reporting.
Connect BI or reverse ETL. Hand off modelled data to dashboards for reporting or to a reverse ETL tool for activation.
Document and hand over. Give marketing and analytics teams a data dictionary and query access, not just a finished dashboard.
An MVP scoped to marketing-only data with few sources can often take several weeks to a few months. An enterprise rollout spanning marketing, sales and product data, with full governance sign-off across departments, usually runs three to six months.
The most common pitfall is skipping step one and jumping straight to connectors, which produces a warehouse full of data nobody trusts because definitions were never agreed. A close second is underestimating the ongoing maintenance transformation logic needs as source platforms change their APIs and reporting fields.
Centralising data doesn’t make it trustworthy on its own. Marketing teams frequently mistake ingestion for insight: pulling everything into one place without standardising what each field actually means creates centralised inconsistency, not a single source of truth.
Build these controls in from the start:
A semantic layer or metric registry that defines every core metric once, so “conversion rate” means the same thing in every dashboard.
Lineage tracking so anyone can trace a number in a report back to its source table and transformation logic.
An access model that restricts who can modify core tables versus who can only query curated marts.
Schema-change monitoring that alerts your team when a source platform changes a field name or data type before it silently breaks a report.
Pro Tip: Define your canonical metrics inside the modelling layer itself, not in the BI tool. If “revenue” is calculated differently in three different dashboards, someone built the logic downstream of the warehouse instead of inside it.
For UK and EU teams, GDPR compliance means documenting your lawful basis for processing customer data, supporting deletion requests across every table that holds personal data, and setting retention limits rather than keeping records indefinitely by default. Building this into your governance model from day one is far cheaper than retrofitting it after an audit. A single source of truth for data also makes compliance reporting genuinely faster, since you’re not chasing the same customer record across five disconnected systems.

These four systems get confused constantly, and picking the wrong one for the job wastes budget.
Marketing data warehouse: built for historical analysis and reporting, batch-updated, requires reverse ETL to activate segments, used mainly by analysts and marketers running deep reporting.
Customer data platform (CDP): built for real-time profile unification and native activation, handles identity resolution out of the box, used by marketers who need to push live segments to ad platforms.
Data lake: stores raw, often unstructured data at scale with minimal upfront modelling, used by data engineering teams for exploratory or machine learning work.
CRM: operational system of record for sales and customer relationships, not designed for cross-channel analytical joins at all.
The most common pairing is a warehouse for deep analysis feeding a CDP for activation. You model and understand your customer data in the warehouse, then sync qualified segments to the CDP, which pushes them live to ad platforms and email tools. Trying to make one system do both jobs usually means compromising on either analytical depth or activation speed.
If you’d rather have senior strategists design this system than assemble it piecemeal from vendor sales calls, Viaduct Generation’s AI-enabled approach to client work builds exactly this kind of infrastructure as part of a connected growth engine, with the FMIS engagement standing as one documented example of the approach applied to a real client’s data and reporting problems. Compared with pure cloud DIY or a generic enterprise platform sale, a marketing-native managed build gets you a working, governed warehouse faster because the modelling patterns and connector logic have already been proven across other engagements. Explore the full services overview if you want that senior-led delivery rather than hiring and managing the build internally.
The most widely used platforms for marketing analytics are Google BigQuery, Snowflake, Microsoft Azure Synapse Analytics, Amazon Redshift and Databricks, each suited to different scale and budget profiles.
Warehouses are commonly categorised by architecture as enterprise data warehouses, data marts (a subset built for one department or use case, such as marketing), and operational data stores; in practice, marketing teams usually start with a data mart focused on their own reporting needs.
ETL stands for extract, transform, load, the process of pulling data from source systems, reshaping it, and loading it into storage; DWH is shorthand for data warehouse, the centralised store where that transformed data lives and gets queried.
A typical example joins ad platform spend data, CRM revenue records and web analytics events inside BigQuery or Snowflake, modelled with dbt, to produce a single attribution report showing true return on ad spend by channel.
Choose a warehouse if your priority is deep historical analysis and reporting; choose a CDP if you need real-time activation of customer segments, and pair both if you need each capability.

