
Log file analysis is the process of extracting and interpreting server records to see exactly which URLs search engine and AI crawlers requested, when, and with what result. It is the single most accurate source of crawler behaviour available to an SEO practitioner, because it records what actually happened at the server, not what a simulated crawler predicts should happen. Every visit from Googlebot, Bingbot, or an AI agent leaves a trace, and that trace tells you where crawl budget is wasted, which pages have gone orphaned, and whether a migration behaved as planned.
The benefits compound quickly once you start reading logs properly:
Log file analysis matters most for large sites with tens of thousands of URLs, teams shipping frequent releases, and JavaScript-heavy platforms where rendering behaviour is unpredictable. If your site fits any of those profiles, this is not an optional technical exercise.
Log file analysis works because it captures actual server requests rather than modelled crawl behaviour, giving practitioners a verifiable basis for prioritising technical fixes.
| Point | Details |
|---|---|
| Logs beat simulations | Server logs record what crawlers actually requested, unlike sampled Search Console data or simulated crawls. |
| Verify before you trust | Confirm crawler identity through reverse DNS and published IP ranges rather than user-agent strings alone. |
| Collect both log layers | Join edge/CDN logs with origin logs by request ID to avoid missing cached or failed requests. |
| Prioritise by waste and value | Rank fixes by crawl budget recovered and commercial impact, not by issue count. |
| Operationalise it as governance | Viaductgen treats recurring log review as an ongoing part of its Growth Engine, feeding prioritisation and revenue reporting rather than a one-off audit. |
A server log is a plain text record of every HTTP request, usually written in Common Log Format or the Combined Log Format that Apache documents in detail, including timing and response code fields. Logs originate at three possible layers: the CDN or edge network, the origin server, and sometimes a web application firewall sitting in front of both. Each layer can show a different picture of the same request.
For SEO purposes, the fields that matter are timestamp, client IP, requested URL, HTTP status code, user-agent string, bytes transferred, referrer, response time, and cache status. A typical combined log line looks like this:
66.249.66.1 - - [10/Feb/2026:03:14:22 +0000] "GET /products/widget HTTP/1.1" 200 5231 "-" "Googlebot/2.1"
Servers running Microsoft IIS record equivalent fields once logging is configured correctly, and Wikipedia’s reference on Common Log Format is a useful cheat sheet when you’re mapping unfamiliar fields during parsing.
Search Console and third-party crawlers estimate crawler behaviour. Log files record it. That distinction is why log file analysis surfaces issues that no simulated crawl or Search Console report will show you, because Search Console samples and aggregates, while logs capture every single hit.
The practical use cases stack up fast:
The ROI case is straightforward on any site above roughly 10,000 indexable URLs, or any site where a recent release, migration, or rendering change has left ranking behaviour unexplained. Below that scale, the effort can still pay off, but the signal-to-noise ratio drops.
Getting from raw server output to something analysable takes five steps, and skipping any of them tends to produce misleading conclusions.
/products/{id} rather than hundreds of unique URLs), and strip static asset requests if they are drowning out the page-level signal.Pro Tip: Before running any analysis, pull a single hour of raw logs and manually trace ten requests end to end. If you can’t answer “was this cached, and did it hit origin?” for each one, your data pipeline has a gap worth fixing before you scale up.
The workflow that actually produces usable findings follows a consistent sequence, and skipping the verification step is the most common mistake practitioners make.
| Metric | What it reveals | Typical red flag |
|---|---|---|
| Status code share | Server health and link hygiene | Rising 4xx or 5xx trend over time |
| Cache hit ratio | Origin load and CDN efficiency | Sudden drop suggesting cache misconfiguration |
| Requests per URL template | Crawl budget allocation | Faceted URLs outweighing product pages |
| Median vs tail latency | Rendering and infrastructure strain | Wide gap suggesting inconsistent origin performance |
Establishing this baseline early means any future anomaly stands out immediately rather than getting lost in normal variation.
Tool choice should follow data volume and team capability, not the other way round.
grep, awk, and spreadsheet pivoting handle the job fine, and desktop analysers give faster visual diagnostics without a learning curve.Whatever you choose, check that the tool preserves request IDs, keeps origin and edge timing separate, and retains cache status fields, because losing any of these during ingestion breaks the verification steps above. Sampling is sometimes unavoidable at extreme volume, but sampled crawl data should never be the basis for a migration validation, where every redirect needs individual confirmation.
Findings only matter once they change something measurable, and prioritisation should follow wasted crawl volume weighted against business impact rather than whichever issue looks most dramatic in a spreadsheet.
Pro Tip: Keep a simple before/after log snapshot for every fix you ship. Six months later, when someone asks whether a canonical change actually worked, you want the log evidence on hand rather than a memory of “it seemed to help.”
Recurring 5xx spikes deserve particular attention, since they often point to origin capacity issues that only show up under crawler load, not during normal traffic patterns.

Log-derived signals feed directly into the intelligence phase of an AI-powered growth system, where crawl waste, orphaned sections, and rendering failures get weighed against commercial priority before a single fix ships. That sequencing matters more than the analysis itself, because a technically correct fix on a low-value template rarely moves revenue.
The engagements that compound aren’t the ones that fix the most issues. They’re the ones that fix the right five issues, in the right order, and then prove it in the next reporting cycle.
Fabio, Co-founder & CEO of Viaductgen, treats recurring log review as a governance function, not a one-off audit. In a retained engagement, that means scheduled re-analysis tied to release cycles, with findings routed through the same optimisation and reporting loop that tracks every other channel, so crawl health sits alongside the KPIs that connect to revenue rather than living in a separate technical silo.
Reading logs manually with grep and spreadsheets works until your site crosses a few hundred thousand URLs, and at that point most in-house teams either buy an expensive enterprise tool or let log review slide to “when we have time,” which is exactly when migrations and rendering regressions go unnoticed. Viaductgen builds recurring log analysis into its SEO, AEO and GEO service, so crawl health gets checked on a schedule tied to your release cycle, not whenever someone remembers.
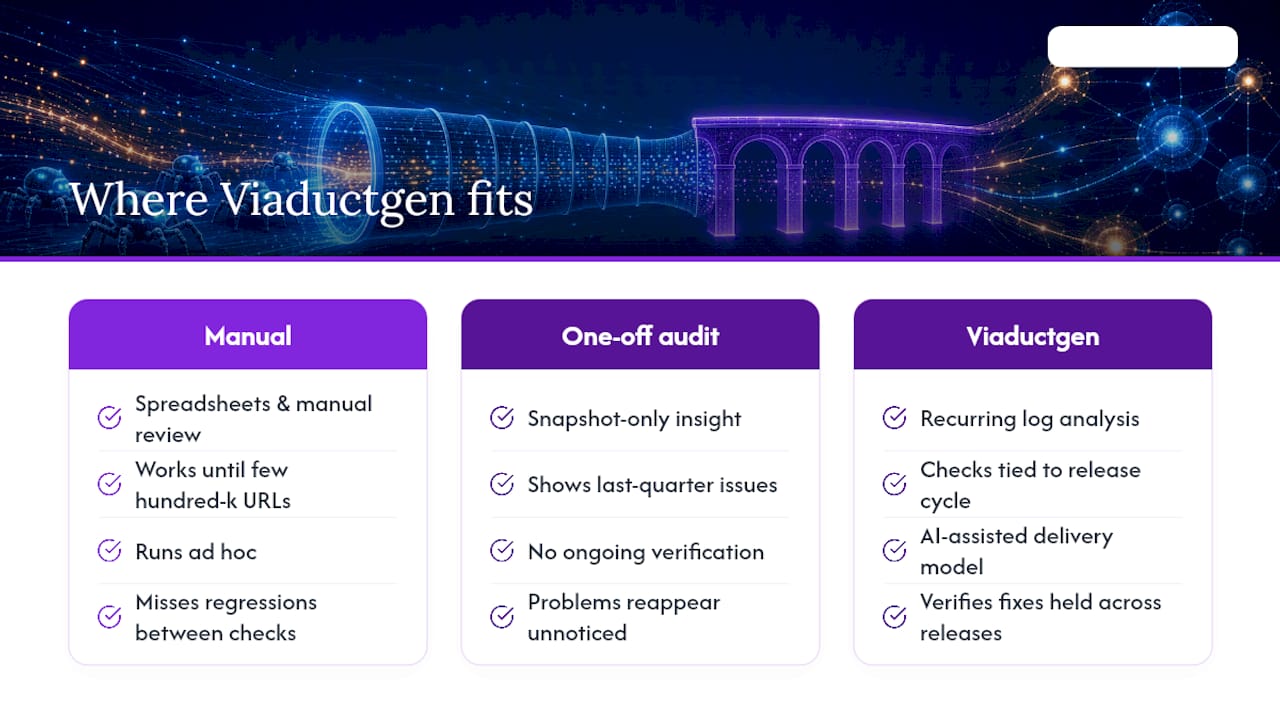
That matters because a one-off audit tells you what was wrong last quarter. A governed process, run through Viaductgen’s AI-assisted delivery model, tells you whether last quarter’s fixes held. If you’re weighing whether to build this capability internally or bring in a partner who already runs it across dozens of engagements, the fastest way to find out is to see how the process would apply to your own log data. Get in touch with Viaductgen to scope a technical SEO engagement built around your crawl data.
Collect edge and origin logs, verify crawlers using reverse DNS and published IP ranges rather than user-agent strings, normalise the data, then group requests by URL template to compare against status codes, latency, and cache hit ratio.
Collect multiple log layers, verify crawler identity properly, set a clear retention policy, normalise timestamps and paths before analysis, and re-measure after every fix to confirm it worked.
Open it in a text editor or command-line tool like less or grep for small files; each line typically follows Common Log Format, showing IP, timestamp, request, status code, and user-agent in a fixed order.
It is the practice of examining server logs to see exactly which pages search engine crawlers requested and how the server responded, revealing crawl budget waste, orphan pages, and migration issues that Search Console alone cannot show.
No. User-agent strings are trivially spoofable, so verification requires reverse and forward DNS lookups combined with the search engine’s published IP ranges.

